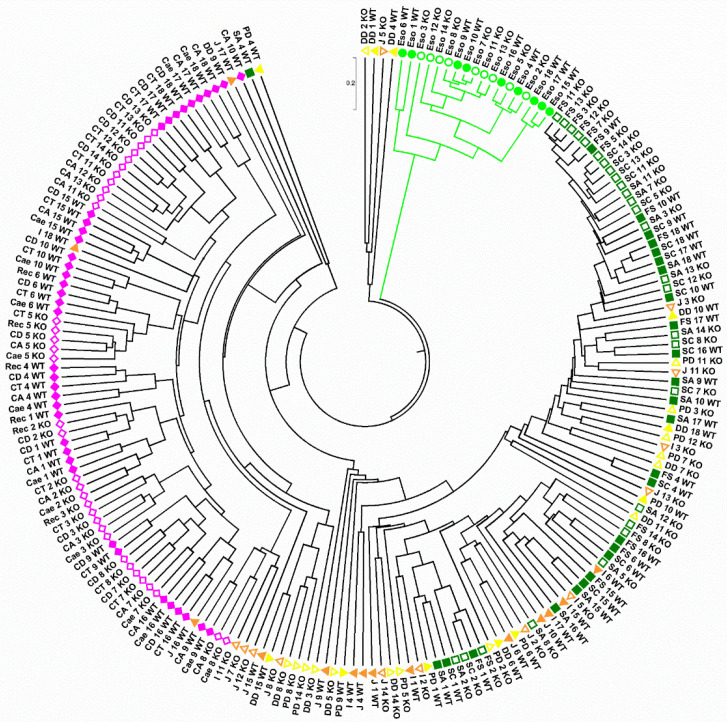
Figure 4.
Group-average agglomerative hierarchical clustering of 197 samples, based on the global bacterial profiles at phylotype level and Bray-Curtis similarities. Each sample is termed by its anatomical region (for details see the legend of Figure 2), the number of the animal (from 1 to 18), and the mouse strain (wild-type or Tff3KO).

