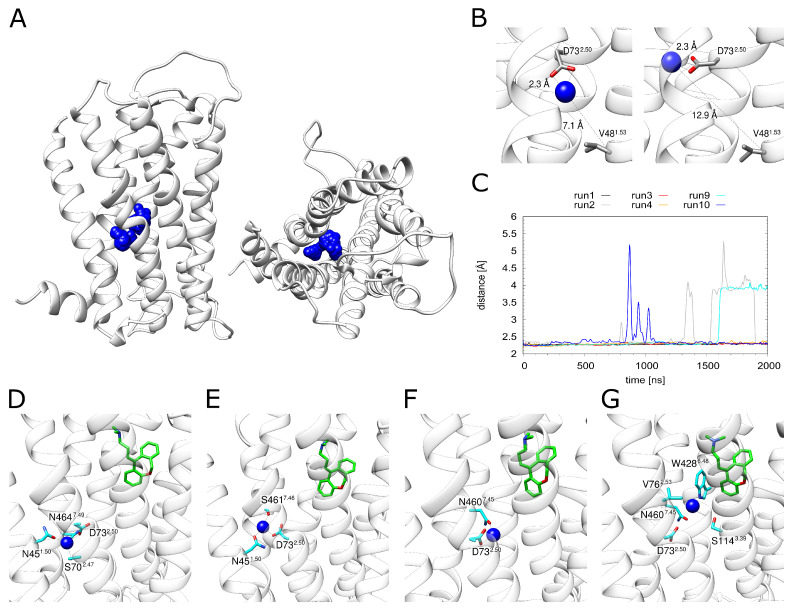
Figure 4.
Dynamics of the sodium ion. (A) H1R structure (white ribbons) depicting the Na+ position (blue spheres) derived from simulation at time intervals of 1 ns. (B) The Na+ ion can adopt different positions in the binding pocket while still remaining attached to D732.50. (C) Distance between D732.50 and the sodium ion for all simulations that contained a sodium ion. H1R-DS (run1, run2), H1R-DSP (run3, run4) and H1R-S (run9, run10). (D–G) Frames from the H1R-DS (run2) simulation at 0 ns, 100 ns, 1000 ns and 1700 ns. Sodium is depicted as a blue sphere, interacting residues are shown in cyan and the ligand doxepin is highlighted by green highlighted carbon atoms. The receptor is shown as a white ribbon.

