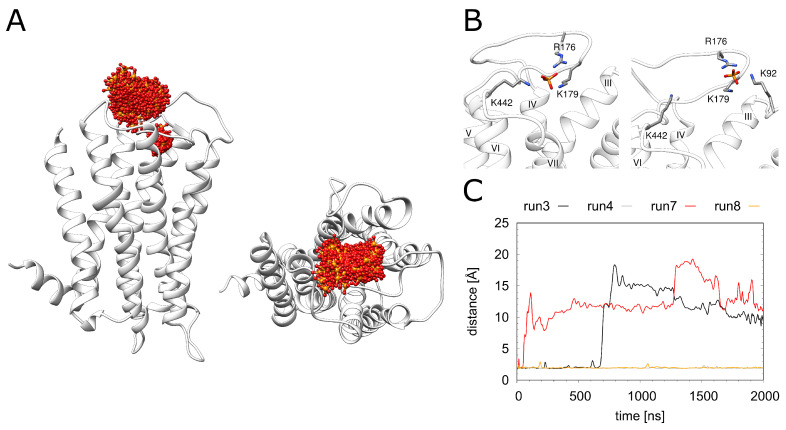
Figure 5.
Dynamics of the phosphate ion. (A) H1R structure (white ribbon) depicting the phosphate position (red/orange sticks) derived from simulation at time intervals of 1 ns. (B) Two representative phosphate binding modes and interacting residues. (C) Distance between K1915.40 and the phosphate for the H1R-DSP (run3, run4) and H1R-P (run7, run 8) simulations.

