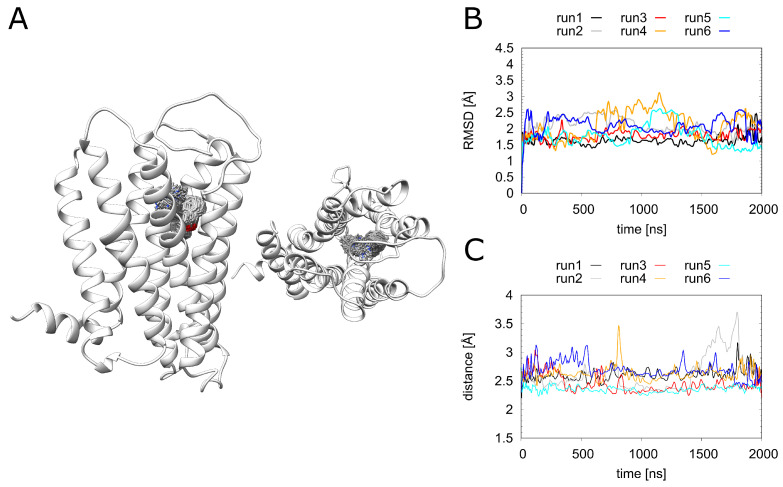
Figure 6.
Doxepin interactions. (A) H1R structure (white ribbon) depicting the doxepin position derived from simulation at time intervals of 1 ns. Doxepin is shown as gray sticks with oxygen in red and nitrogen in blue. (B) The ligand RMSD and (C) minimum doxepin-D1072.50 distance over the simulation time. H1R-DS (run1, run2), H1R-DSP (run3, run4), H1R-D (run5, run6).

