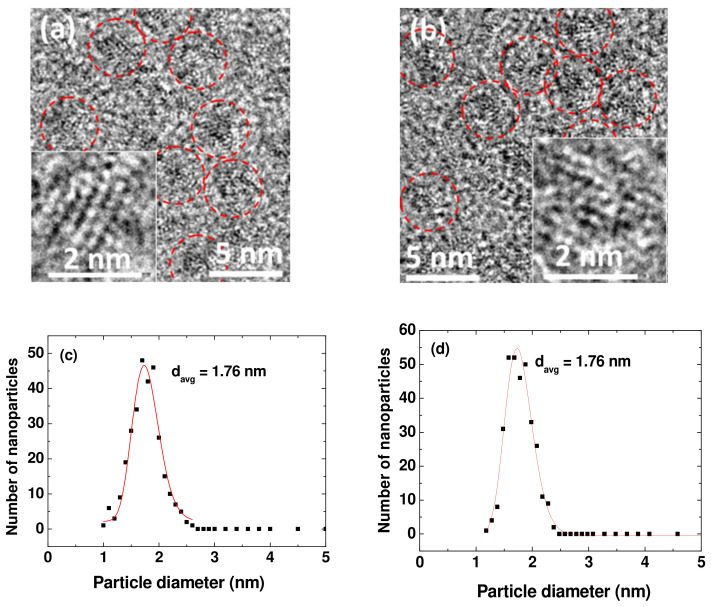
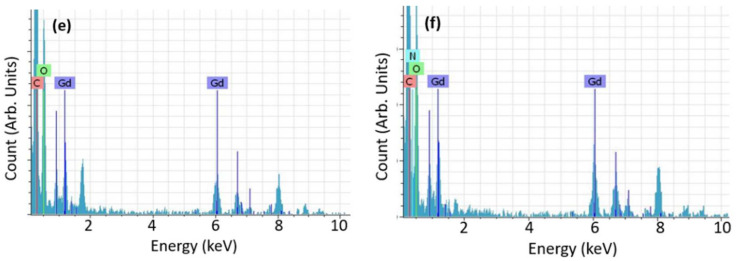
Figure 1.
HRTEM images of the (a) PAA-UGONs and (b) GlcN-PAA-UGONs. Dotted circles indicate nanoparticles, and the insets show magnified HRTEM images on a 2 nm scale. Log-normal function fits to observed particle diameter distributions in the (c) PAA-UGONs and (d) GlcN-PAA-UGONs. EDS spectra of the (e) PAA-UGONs and (f) GlcN-PAA-UGONs.


