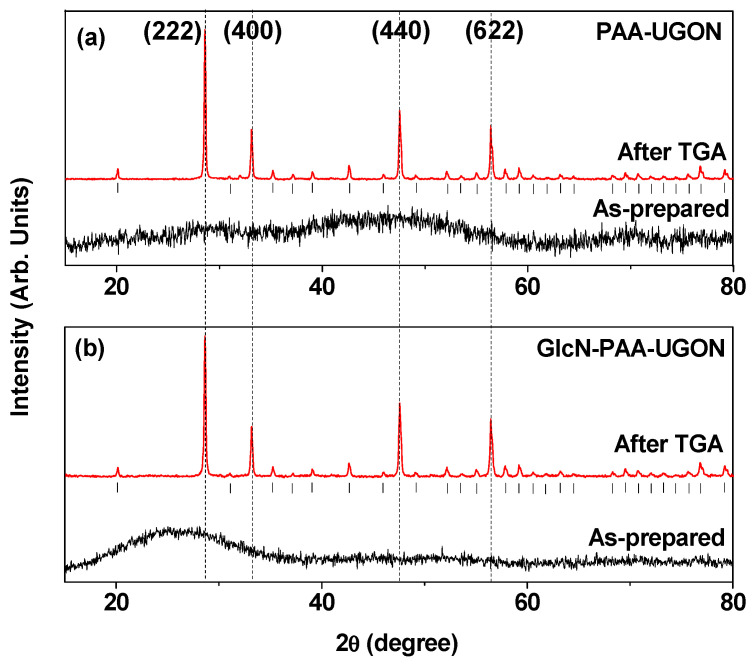
Figure 3.
XRD patterns prior to (as-prepared) and after TGA: (a) PAA-UGONs and (b) GlcN-PAA-UGONs. The representative assignments on strong XRD peaks after TGA are (hkl) Miller indices of cubic Gd2O3. All peaks (labeled with vertical bars below the XRD peaks after TGA) could be designated (hkl) Miller indices of cubic Gd2O3.

