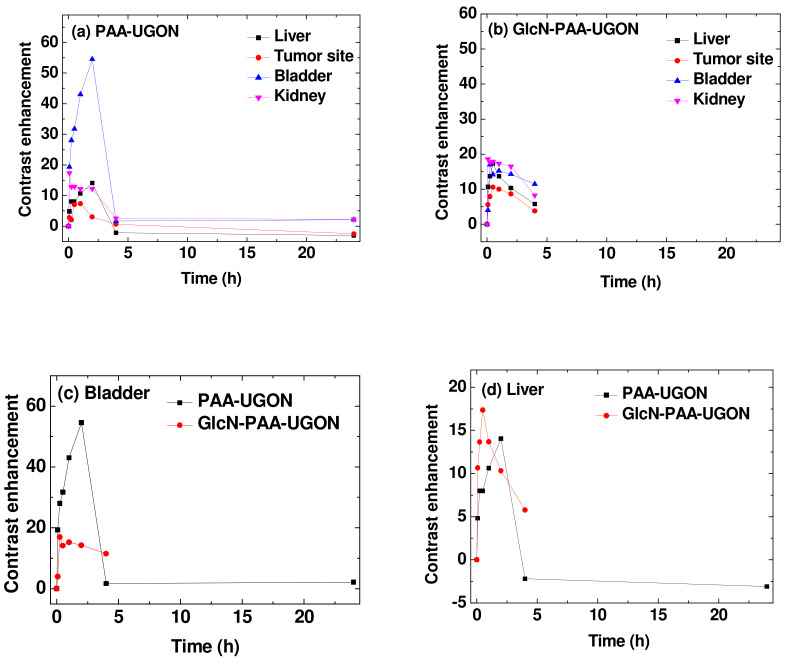
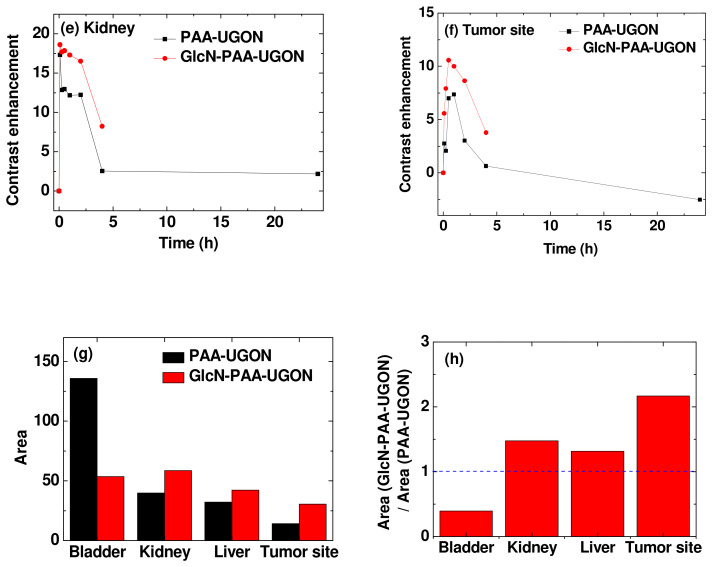
Figure 10.
Plots of contrast enhancements [SNR-ROI (time)–SNR-ROI (0)] as a function of time for the (a) PAA-UGONs and (b) GlcN-PAA-UGONs. Plots of contrast enhancements as a function of time for the PAA-UGONs and GlcN-PAA-UGONs in the (c) bladder, (d) liver, (e) kidney, and (f) tumor site. (g) Plots of contrast enhancement curve areas below the curves between 0 and 4 h in the liver, kidney, bladder, and tumor site. (h) Plots of area ratios for the GlcN-PAA-UGONs to the PAA-UGONs in the liver, kidney, bladder, and tumor site.


