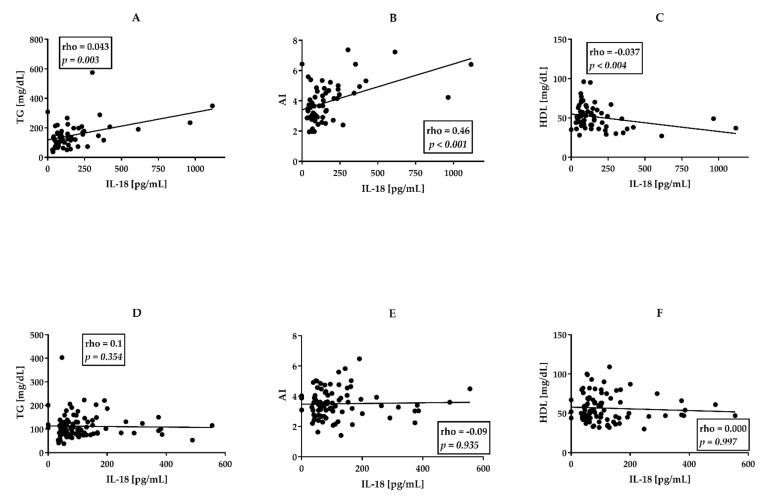
Figure 1.
Correlations between IL-18 and lipid profile in patients with PsA ((A–C), n = 61) in comparison with AS patients ((D–F), n = 94). AI—atherogenic index. TG—triglycerides. HDL—High-Density Cholesterol. All correlations were analyzed using Spearman’s rank test. Rho—Spearman’s rank correlation coefficient. p—value for null hypothesis for Spearman’s rank correlation.

