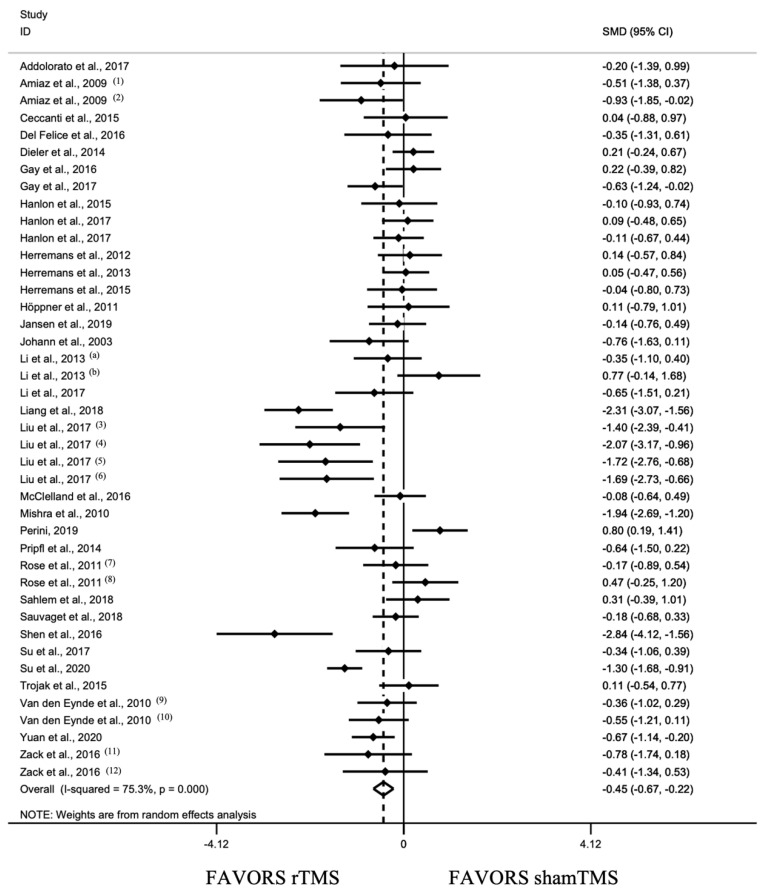
Figure 3.
Forest plot for all included studies pooled together using random effects model (34 studies, 42 units of analysis) [80,81,82,83,84,85,86,87,88,89,90,91,92,93,94,95,96,97,98,99,100,101,102,103,104,105,106,107,108,109,110,111,112,113]. Heterogeneity: Q = 165.67, df = 41, p < 0.001, I2 = 75.3%. (1), craving evaluated by Visual Analog Scale (VAS); (2), craving evaluated by sTCQ; (3), high frequency left DLPFC stimulation; (4), high frequency right DLPFC stimulation; (5), low frequency left DLPFC stimulation; (6), low frequency right DLPFC stimulation; (7), low frequency stimulation; (8), high frequency stimulation; (9), craving evaluated by VAS; (10), craving evaluated by FCQ-s; (11), high frequency MPFC stimulation; (12), low frequency right DLPFC stimulation; (a), [103]; (b), [89].

