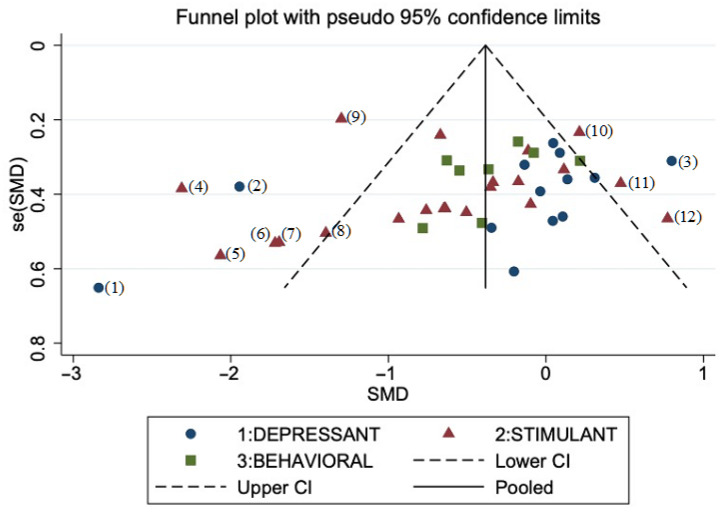
Figure 4.
Funnel plot for publication bias of the included studies (42 units of analysis). (CI, confidence interval; SE, standard error; SMD, standard mean difference). Type of addiction: depressant (alcohol, cannabis, opiate); stimulant (nicotine, cocaine, methamphetamine); behavioral (eating disorder, gambling disorder). Outlier studies excluded from sensitivity analysis: (1), [108]; (2), [106]; (3), [86]; (4), [84]; (5–8), [85]; (9), [110]; (10), [95]; (11), high frequency arm from [88]; (12), [89].

