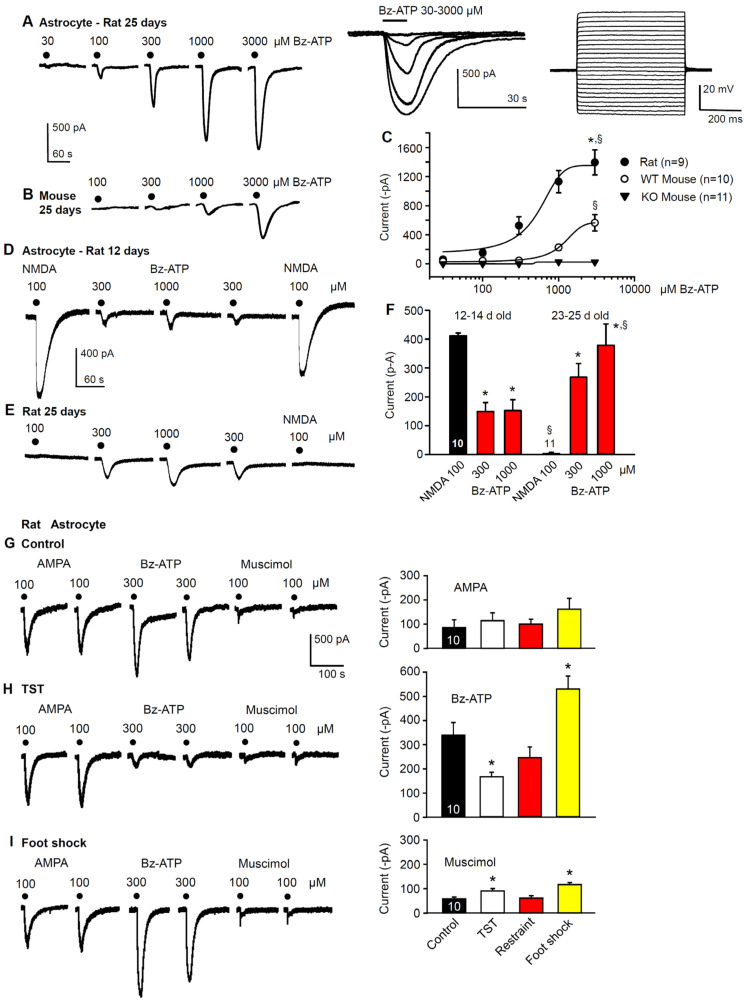
Figure 3.
Bz-ATP-induced current responses in the hippocampal CA1 astrocytes of rats and mice, and their modification after the development of learned helplessness. Concentration-dependent increase of the current amplitudes (A) and current durations (A, left inset) caused by Bz-ATP, in preparations taken from 25-day old rats; representative tracings recorded at a holding potential of −80 mV. Bz-ATP (30–3000 µM) was applied every 3 min for 10 s. (A, left inset) superimposed current responses are shown at a longer time scale than those displayed in A. (A, right inset) injection of gradually increasing current pulses evoked only electrotonic changes in membrane potential and characterized astrocytes as belonging to the passive group. (B) concentration-dependent increase of the current amplitudes caused by Bz-ATP (100–3000 µM) in preparations taken from 25-day old mice. (C) plot of the Bz-ATP concentration against the current amplitude in astrocytes from rats, WT mice and P2X7R KO mice. Mean ± SEM of the indicated number of concentration-response relationships are shown. There was no response to Bz-ATP when hippocampal slices were prepared from the P2X7R KO mice. * p < 0.05; statistically significant difference from the effect of Bz-ATP (3000 µM) in WT mice (C, t = 4.033, p = 0.001; Student’s t-test). § p < 0.05; statistically significant difference from the effect of Bz-ATP (3000 µM) in the P2X7R KO mice (C, T = 144.00, p < 0.001; Mann–Whitney rank sum test). Current responses to NMDA (100 µM) and Bz-ATP (300, 1000 µM) of astrocytes prepared from 12-day (D) or 25-day old (E) rats; representative tracings. (F) mean ± SEM of the indicated number of experiments. * p < 0.05; statistically significant difference from the effect of NMDA (100 µM), in 12–14-day old astrocytes (B, F = 5.725, Bz-ATP 300 µM, p = 0.019, Bz-ATP 1000 µM, p = 0.014; one-way ANOVA, followed by the Holm–Sidak test), and from the effect of NMDA (100 µM) in 23–25-day old astrocytes (B, Bz-ATP 300 µM, p < 0.001, Bz-ATP 1000 µM, p = 0.002; one-way ANOVA, followed by the Holm–Sidak test, respectively). § p < 0.05; statistically significant difference from the effect of the corresponding NMDA (100 µM) and Bz-ATP (1000 µM) effects in the 12–14-day old group of astrocytes. (B, NMDA-NMDA, T = 165.00, p < 0.001, BzATP-BzATP, T = 165.00, p < 0.001; Mann–Whitney rank sum test). (G–I) current responses to AMPA (100 µM), Bz-ATP (300 µM) and muscimol (100 µM) in hippocampal CA1 astrocytes prepared from 20–25-day old rats. Representative tracings from brain slices taken from untreated (G, left panel), TST-treated (H, left panel) and foot shock-treated (I, left panel) rats. In the respective right panels, the mean ± SEM of identical experiments are shown for AMPA, Bz-ATP and muscimol. * p < 0.05; statistically significant difference from Bz-ATP (H, right panel, F = 12.285, TST, p = 0.029, foot shock, p = 0.018) and muscimol (I, right panel, F = 10.170, TST, p = 0.046, foot shock, p < 0.001) currents in control CA1 astrocytes (one-way ANOVA, followed by the Holm–Sidak test).

