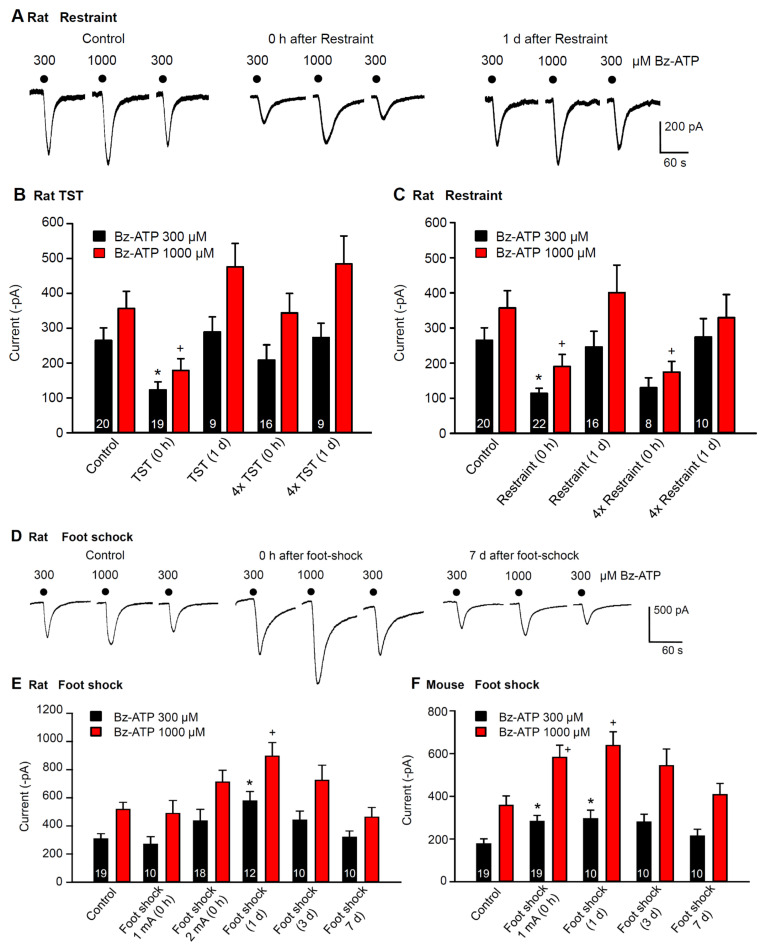
Figure 4.
Effects of learned helplessness on Bz-ATP-induced current amplitudes in hippocampal CA1 astrocytes of rats and mice. (A) current responses of astrocytes to Bz-ATP (300, 1000 µM), prepared from rats which underwent no stress (control), or restraint stress, immediately or 1 day before preparing their hippocampal slices for recordings. Representative tracings. (B) mean ± SEM of current amplitudes in brain slices from rats unstressed (control) or stressed by TST. Current measurements were made immediately after TST (0 d), 1-day after TST (1 d), immediately after the last TST in a series of 4, applied on each consecutive day, and 1 day after a series of such stimulations. In this and all further experiments, two responses to Bz-ATP (300 µM) were averaged for further calculations. (C) mean ± SEM of current amplitudes in brain slices from rats unstressed or stressed by restraint. Measurements were immediately after restraint, 1-day after restraint, immediately after the last restraint in a series of 4, applied on each consecutive day, and 1 day after such a series of stimulations. (D) current responses of astrocytes to Bz-ATP (300, 1000 µM), prepared from rats which underwent no stress, or inescapable foot shock, immediately or 1, 3 and 7 days before preparing their hippocampal slices for recording. Representative tracings. (E) mean ± SEM of current amplitudes in brain slices from rats unstressed or stressed by foot shock. Current measurements were made immediately after foot shock with 1 mA or 2 mA current strength, as well as 1, 3 and 7 days after foot shock with 2 mA current strength. (F) mean ± SEM of current amplitudes in brain slices from mice unstressed or stressed by foot shock. Current measurements were made immediately after foot shock with 1 mA current strength, as well as 1, 3 and 7 days after foot shock. * p < 0.05; statistically significant differences from the effect of Bz-ATP (300 µM) in control preparations (B, F = 3.571, TST (0 h), p = 0.027; C, F = 4.852, restraint (0 h), p = 0.008; E, F = 4.473, foot shock (1 d), p = 0.001; F, F = 3.044, foot shock 1 mA (0 h), p = 0.025, foot shock (1 day), p = 0.033). + p < 0.05; statistically significant differences from the effect of Bz-ATP (1000 µM) in control preparations. (B, F = 5.073, TST (0 h), p = 0.005; C, F = 4.070, restraint (0 h), p = 0.033, 4× restraint (0 h), p = 0.030; E, F = 4.505, foot shock (1 d), p = 0.002; F, F = 4.318, foot shock (1 mA), p = 0.006, foot shock (1 d), p = 0.006). One-way ANOVA followed by the Holm–Sidak test in each case. The number of experiments is indicated throughout in each pair of columns (B,C,E,F).

