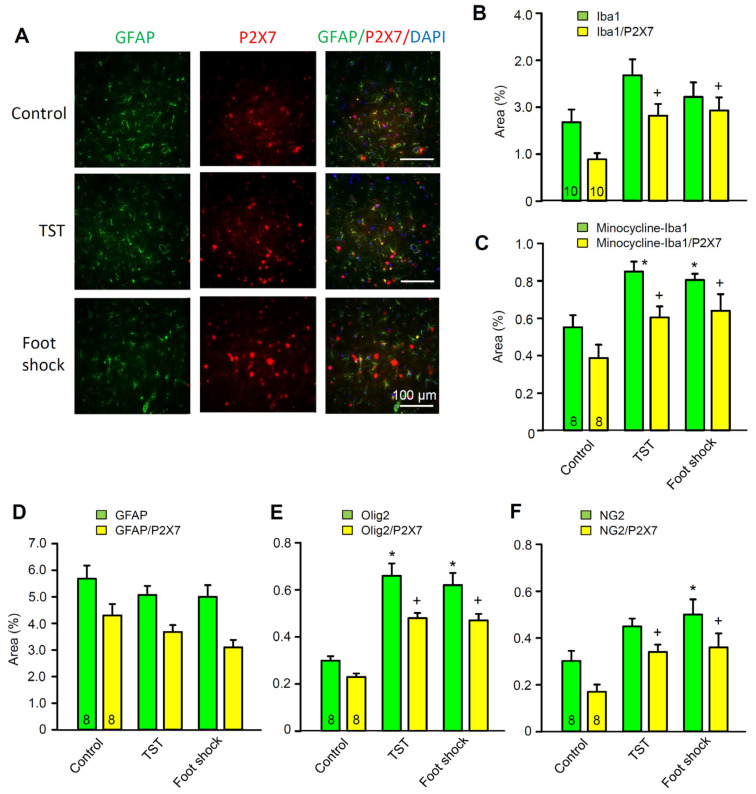
Figure 6.
Effects of the TST and foot shock on P2X7R-immunoreactivities (IRs), with microglial (Iba1), astroglial (GFAP), and (pro)oligodendroglial (Olig2, NG2) markers as well as their co-localization with 4’,6-diamidino-2-phenylindol (DAPI) in the hippocampal CA1 region of 3-week old rats. (A) fluorescence microscopic pictures of immunopositive cells and DAPI-labelled nuclei. The astrocytic marker glial fibrillary acidic protein (GFAP; green fluorescence)-IR co-stains with the red fluorescent P2X7R-IR, and the blue fluorescent DAPI. Triple-labelling of all three IRs is displayed in the right row of the picture as shown. One representative snapshot obtained from the hippocampi of 8 animals. Scale bars, 100 µm. (B–F) The stained sections were examined under 400× magnification of the microscope over the whole image; the IF was evaluated with ImageJ software and, after subtracting the background, it was expressed as a % of the whole area. (B,C) the Iba1/P2X7-IR was increased by the TST and foot shock both with and without minocycline pretreatment of mice (see Section 4). However, minocycline largely decreased the number and density of the microglial cells. (E,F) oligodendrocytes and NG2 glial cells responded to the TST and foot shock in a similar manner as microglia did. (D) neither the GFAP- nor the GFAP/P2X7R-IR changed after TST or foot shock stimulation in comparison with the unstressed controls. * p < 0.05; statistically significant difference from the first column in a triad of columns in each panel (B, F = 2.635, p = 0.090; C, F = 9.681, TST, p = 0.002, foot shock, p = 0.005; D, F = 0.751, p = 0.484; E, F = 20.661, TST, p < 0.001, foot shock, p < 0.001; F, F = 4.258, TST, p = 0.093, foot shock, p = 0.032). + p < 0.05; statistically significant difference from the second column in a triad of columns in each panel (B, F = 6.206, TST, p = 0.016, foot shock, p = 0.010; C, F = 7.581, TST, p = 0.009, foot shock, p = 0.006; D, F = 3.265, p = 0.058; E, F = 41.398, TST, p < 0.001, foot shock, p < 0.001). One-way ANOVA, followed by the Holm–Sidak test in each case. The number of experiments is indicated in the first set of columns.

