Figure 2.
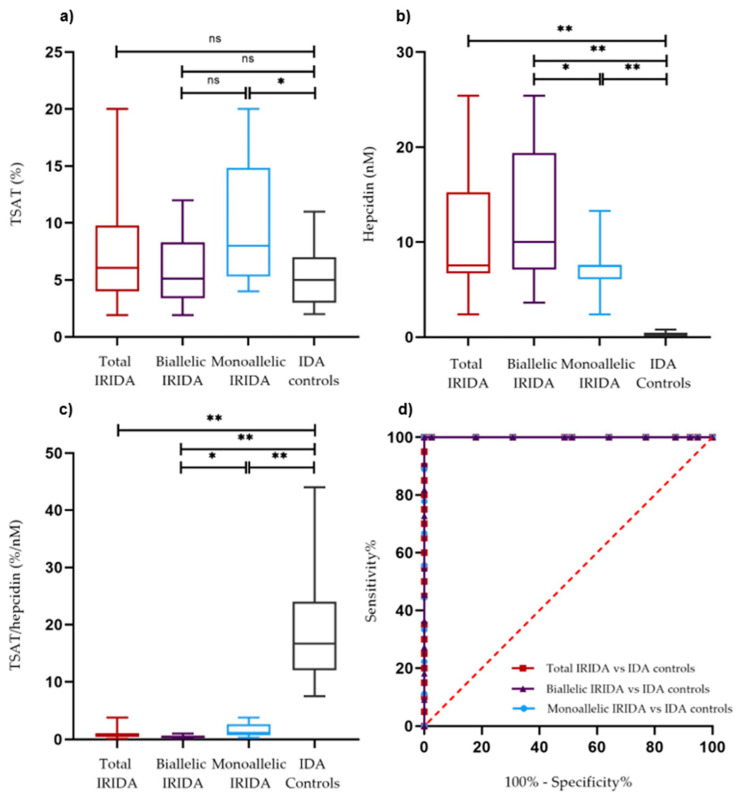
(a–c) Transferrin saturation (TSAT), plasma hepcidin levels, and TSAT/hepcidin ratio in the total IRIDA group (n = 20), biallelic IRIDA patients (n = 11), monoallelic IRIDA patients (n = 9) and IDA controls (n = 39). Box and whisker plots present the quartiles (box), the medians (bold line), and the minimum and maximum (whiskers). (d) Receiver Operating Characteristic (ROC) curve analysis (see also Supplemental Table S1) comparing the TSAT/hepcidin ratio (%/nM) in IDA controls versus the total IRIDA group (red), versus the biallelic IRIDA group (purple), and versus the monoallelic IRIDA group (blue). Ns, not significant; * = p < 0.05; ** = p < 0.001, by non-parametric Mann–Whitney U test. AUC, area under the curve.

