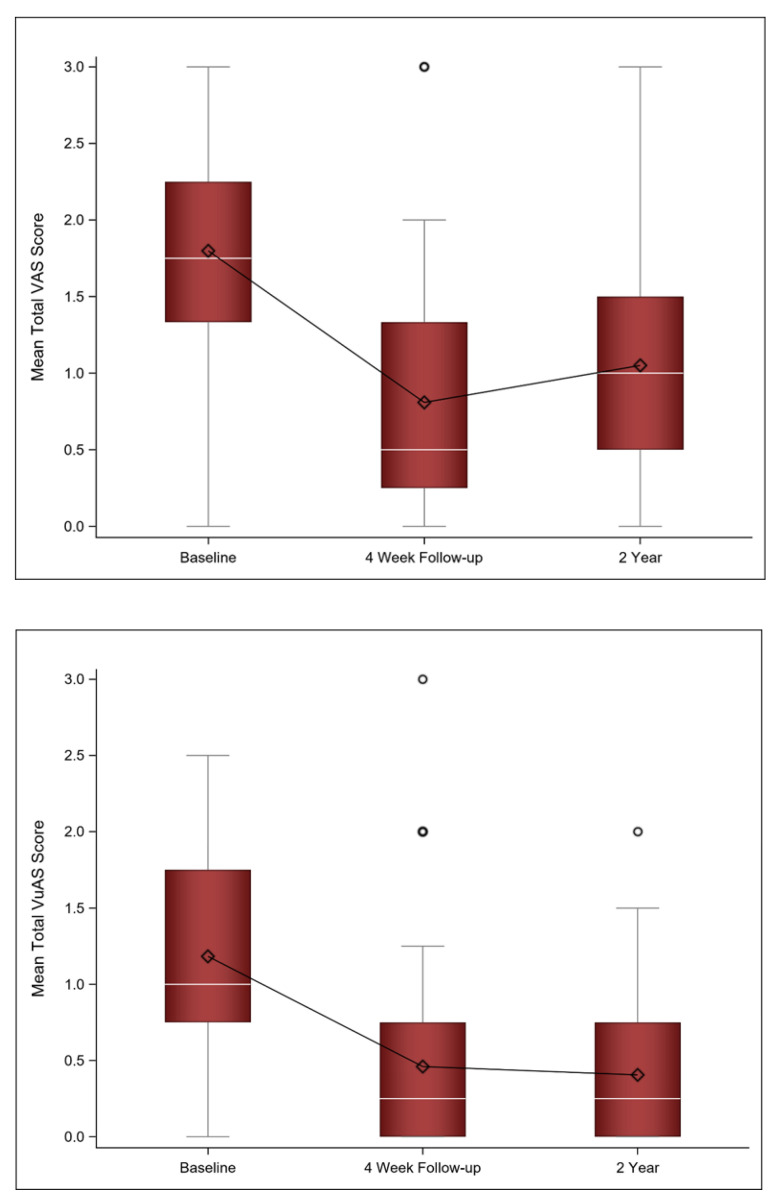
Figure 2.
Mean (diamond), median (white line), and the 1st and 3rd quartiles are displayed for the VAS and VuAS at baseline, 4 week, and 2 year follow-up. The whiskers are the distance equal to 1.5 times the interquartile range (IQR). The diagram also shows outliers (circles) which are values that above or below the whisker ends. VAS = Vaginal Assessment Scale; VuAS = Vulvar Assessment Scale.

