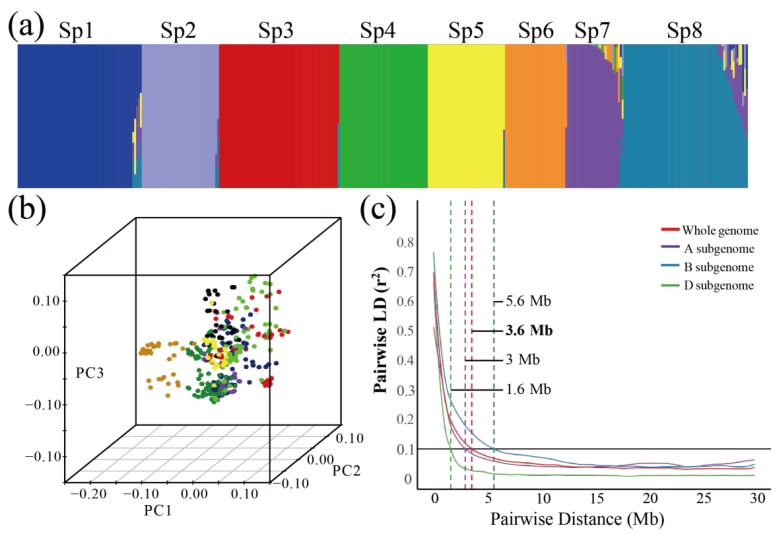
Figure 1.
Population structure and LD analysis of the wheat panel. (a) Subpopulations inferred by K-means structure analysis. (b) Principal component analysis of all wheat accessions. (c) Genome-wide average LD decay over physical distance. Pair-wise single-nucleotide polyLD (r2) values based on the physical positions from the IWGSC RefSeq v.1.0 reference genome are plotted as a function of mapping distance (Mb) between markers. The different-coloured curves represent LD decay fits for sub-genomes A (purple), B (blue), D (green), and the whole genome (red). The thick horizontal black line represents the population-specific critical r2 value (0.1) above which LD may be due to linkage.

