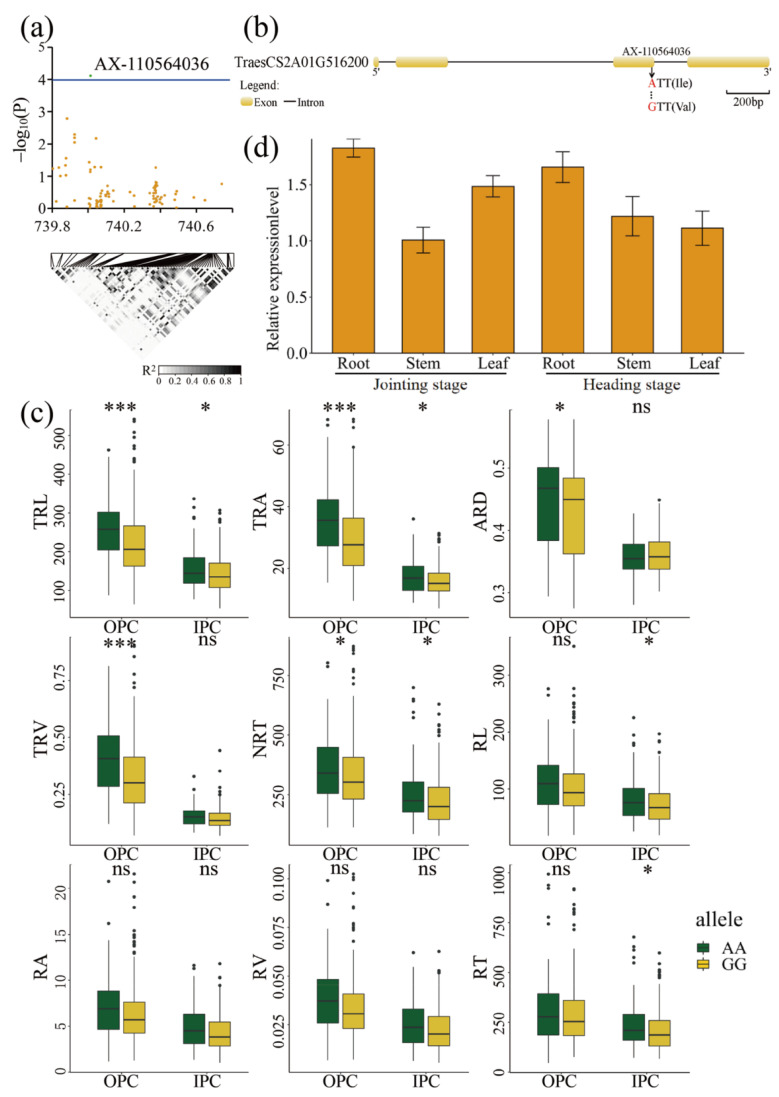
Figure 5.
GWAS results of the nine RSA traits and identification of candidate gene for the SNP AX-110564036 on chromosome 2A. (a) Manhattan plot for the candidate region on chromosome 2A. The green dot represents the significant SNP AX-110564036. The LD block analysis of the SNPs in this region is shown below. The degree of linkage is represented by the coefficient of r2. (b) Gene structure of TraesCS2A01G516200 and its non-synonymous SNP. Yellow rectangles and black lines represent exons and introns, respectively. The arrow indicates the position of amino acid variations in TraesCS2A01G516200. (c) Box plots for RSA traits based on the allele at SNP AX-110564036. Differences between the haplotypes were statistically analysed using the Student’s t-test. The upper and lower edges of the box represent the 75th and 25th quantiles, respectively, and the whiskers show the 90th and 10th quantiles; the horizontal solid line represents the average; * Significant at p ≤ 0.05, *** Significant at p ≤ 0.001. (d) Expression profile of TraesCS2A01G516200 in different tissues, as determined by RT-qPCR. The data are the means ± Sd of n = 3. ‘ns’ means ‘not significant’.

