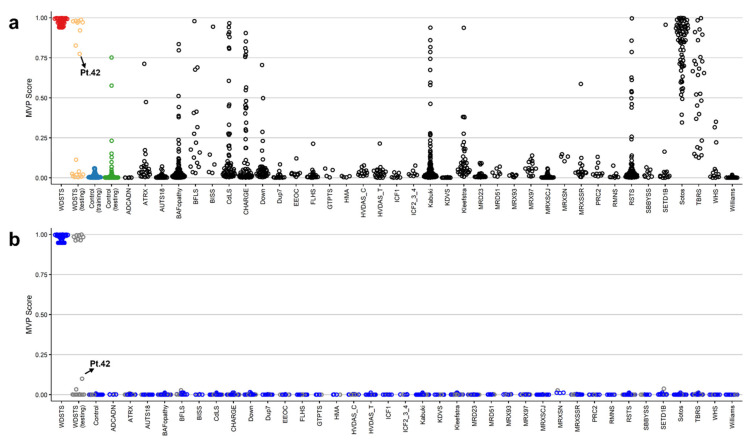
Figure 3.
The methylation variant pathogenicity (MVP) scores plot. (a) The MVP scores were created by the SVM trained by comparing the 41 WDSTS samples against controls; (b) the MVP scores created by the SVM trained by comparing 41 WDSTS samples against controls and 38 neurodevelopmental disorders and congenital anomalies available in the EKD. The blue circles represent the training samples and the grey circles represent the testing samples.

