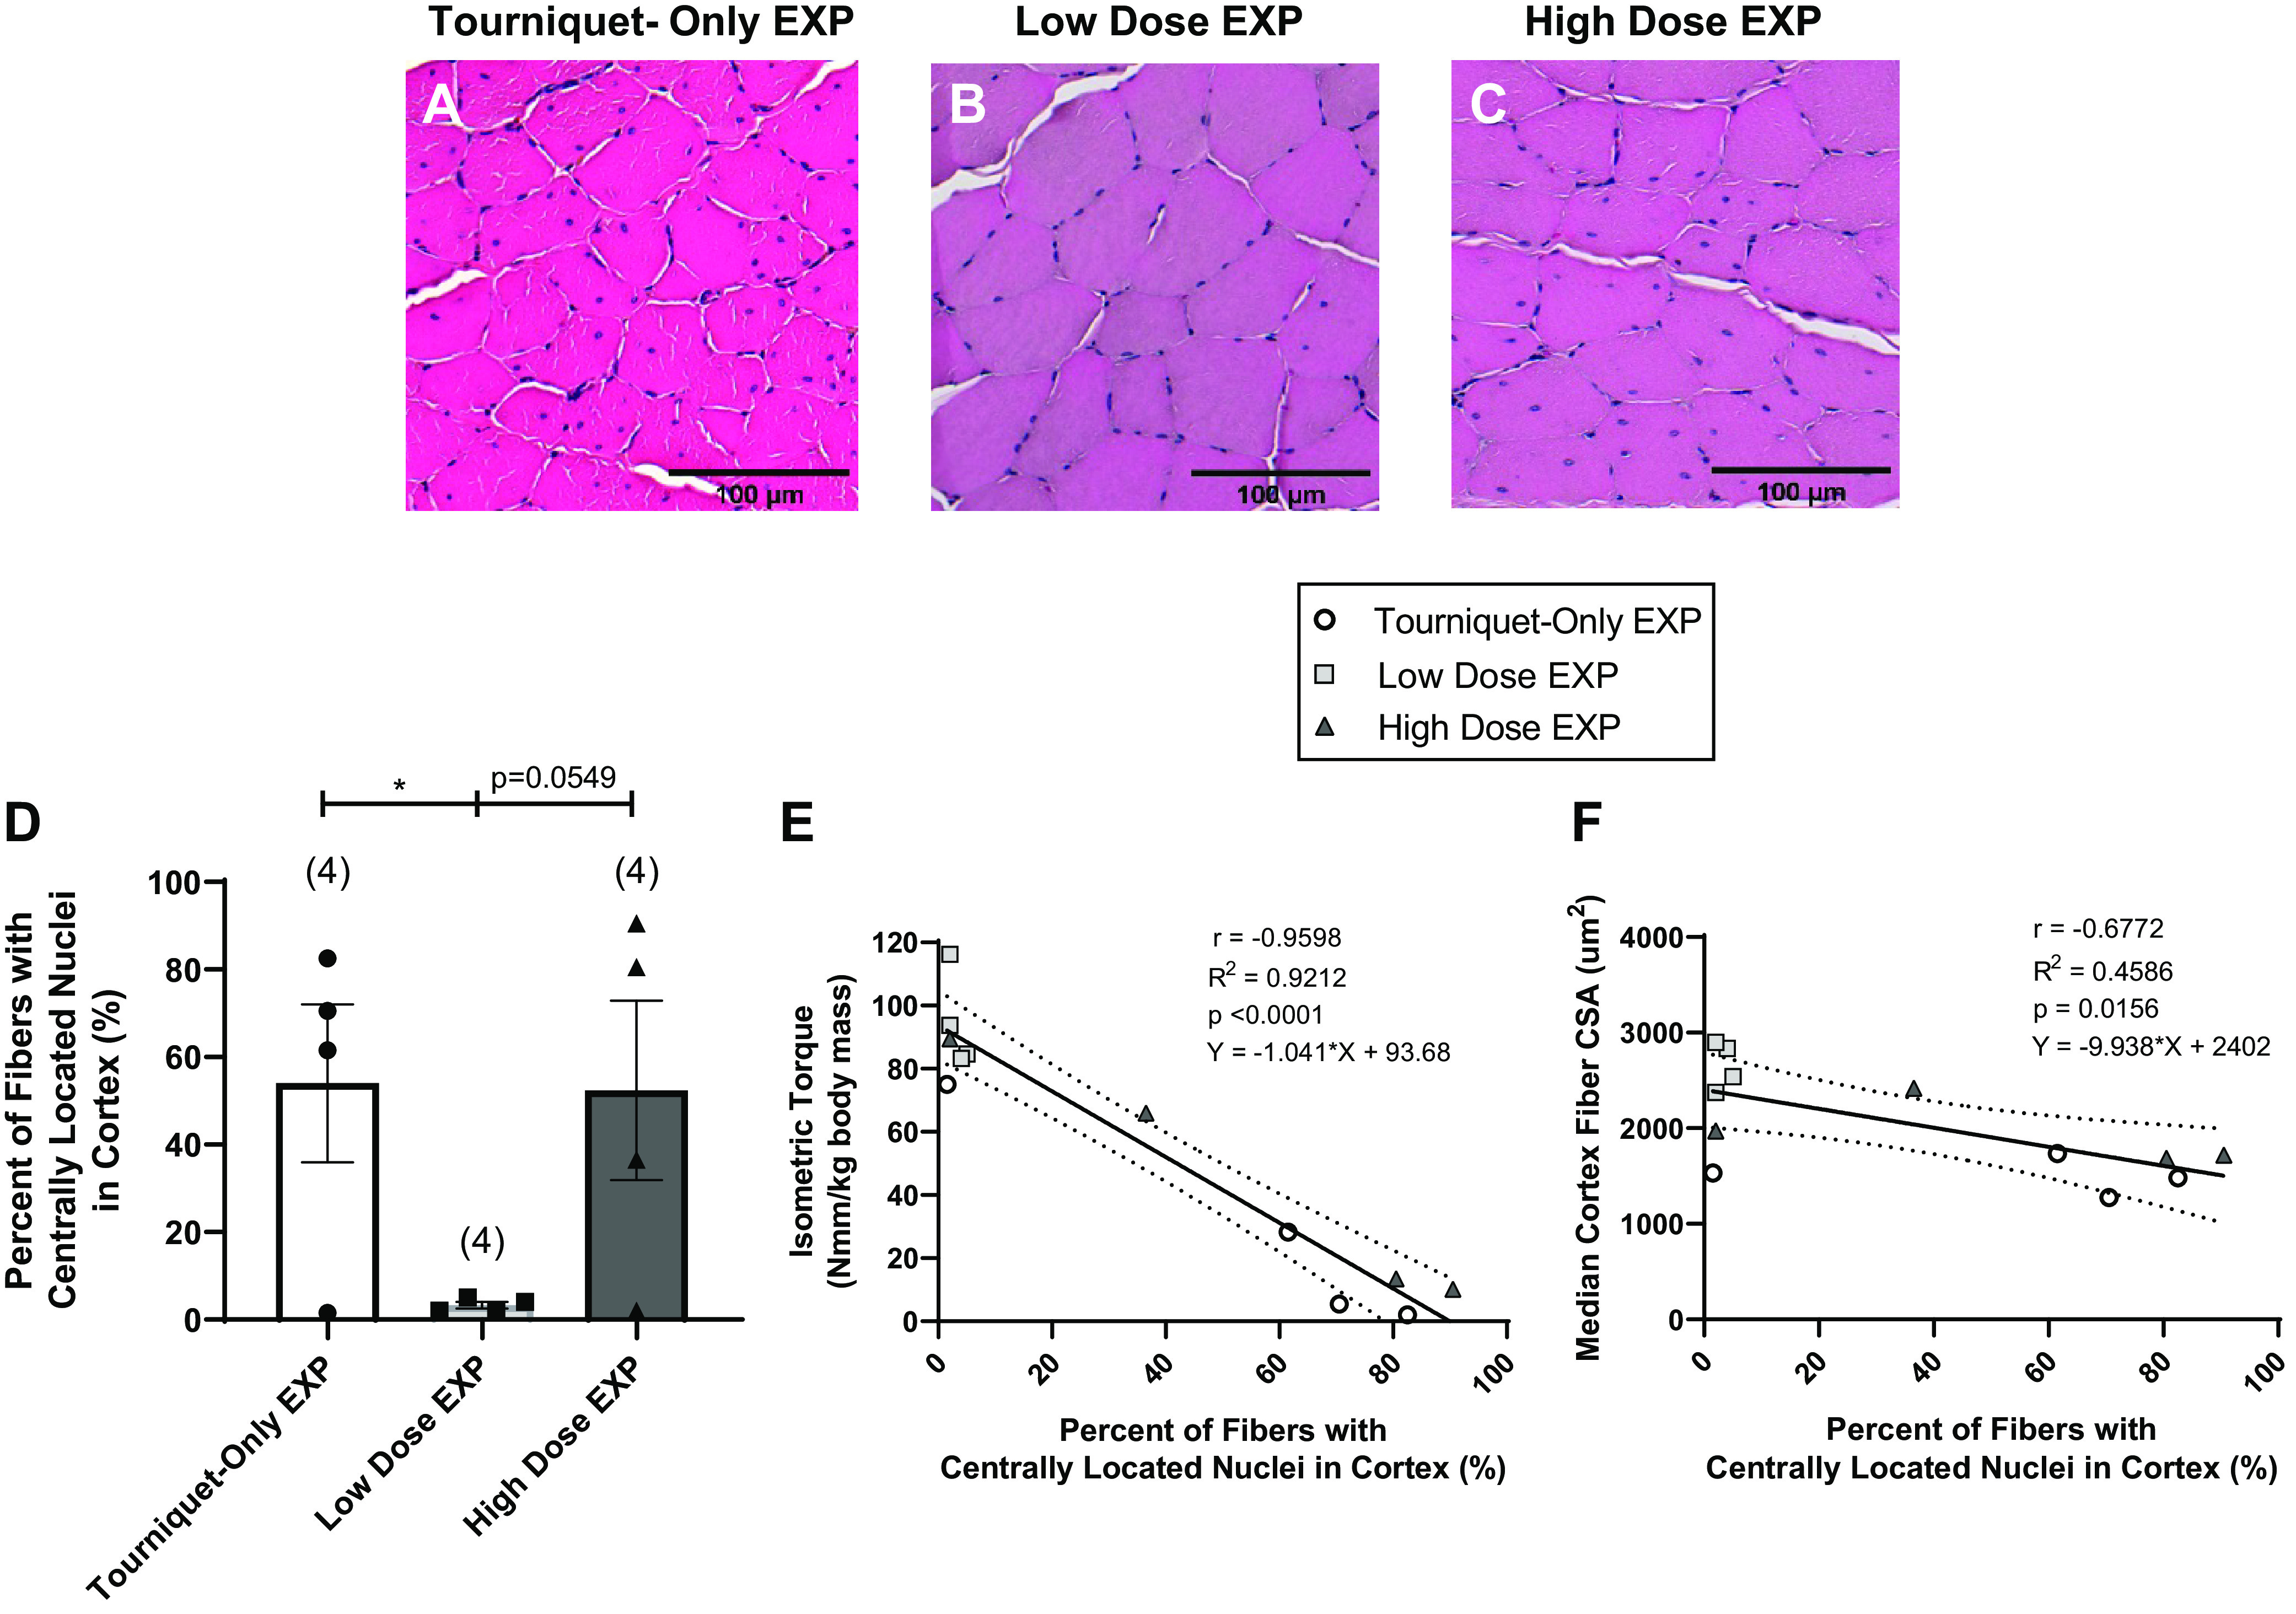
Figure 5.

A–C: representative hematoxylin and eosin (H&E) images show the centrally located nuclei within fibers for the Tourniquet-Only (A), Low-Dose (B), and High-Dose (C) groups. EXP, experimental. D: the percentage of fibers containing centrally located nuclei was determined for n = 4 animals/group by manually analyzing ∼200 fibers in the cortex of each muscle, and the percentage of fibers identified with centrally located nuclei was calculated. Different at *P < 0.05; ordinary 1-way ANOVA with post hoc pairwise comparisons using Fisher’s least significant difference (LSD). Data are presented as means ± SE. There is a difference between the Tourniquet-Only group and the Low-Dose group (P = 0.0488). E and F: Straight line fit of the data showed an inverse correlation between appearance of centrally located nuclei and both isometric torque and fiber cross-sectional area (CSA) in the cortex. More specifically, a lower percentage of centrally located nuclei at the time of explant corresponded to higher isometric torque at 4 wk postinjury (E) as well as higher median cortex fiber CSAs (F), with slopes deviating from 0 (P < 0.0001 and P = 0.0156, respectively). Pearson correlation coefficient (r), R2, P value, and line equation are shown for each plot; 95% confidence bands are shown by the dotted lines for linear regression plots. Number of animals analyzed per group shown in parentheses.
