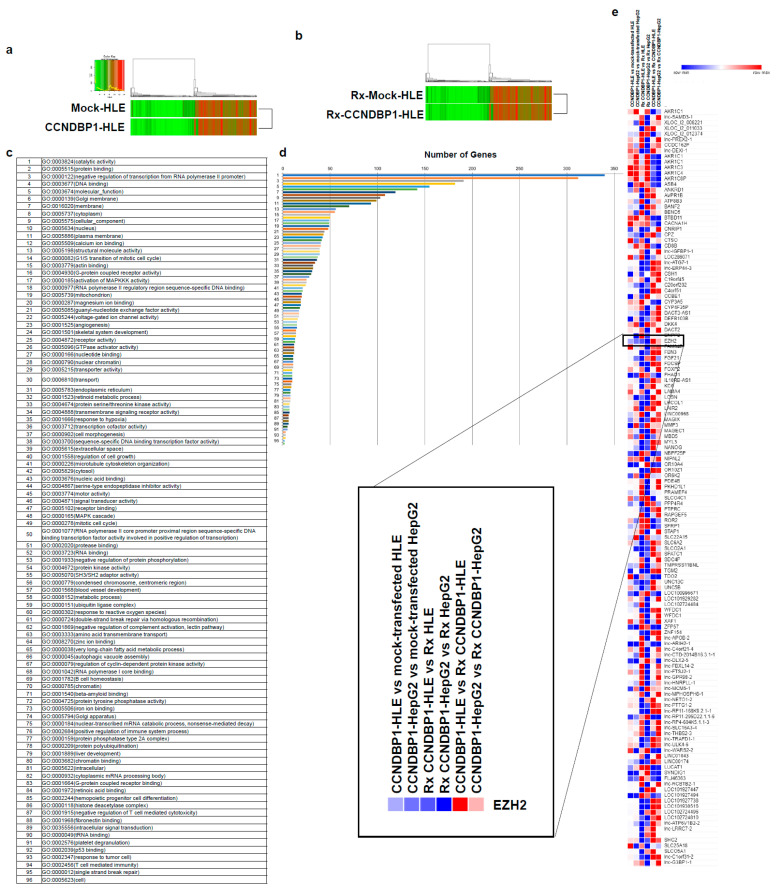
Figure 2.
Microarray analyses in vitro. (a) Microarray analyses were performed to compare the levels of gene expression in mock-transfected HLE and CCNDBP1-transfected HLE. (b) X-ray irradiated mock-transfected HLE and X-ray irradiated CCNDBP1-transfected HLE. A total of 6597 genes with more than two-fold differences in expression were clustered hierarchically according to the level of gene expression. The color represents the expression level of the gene; green represents low degree of change in expression, whereas red represents high degree of change of expression. The color key and histogram are shown. (c) The gene ontology terms related with the genes that have more than two-fold differences between the mock-transfected HLE and CCNDBP1-transfected HLE are shown. (d) The number of genes included in each ontology are shown. (e) The expression level of genes showed more than two-fold changes in all comparisons between CCNDBP1-HLE and mock-transfected HLE, CCNDBP1-HepG2 and mock-transfected HepG2, Rx CCNDBP1-HLE and Rx mock-transfected HLE, Rx CCNDBP1-HepG2 and Rx mock-transfected HepG2, CCNDBP1-HLE and Rx CCNDBP1-HLE, and CCNDBP1-HepG2 and Rx CCNDBP1-HepG2. Rx, X-ray irradiation.

