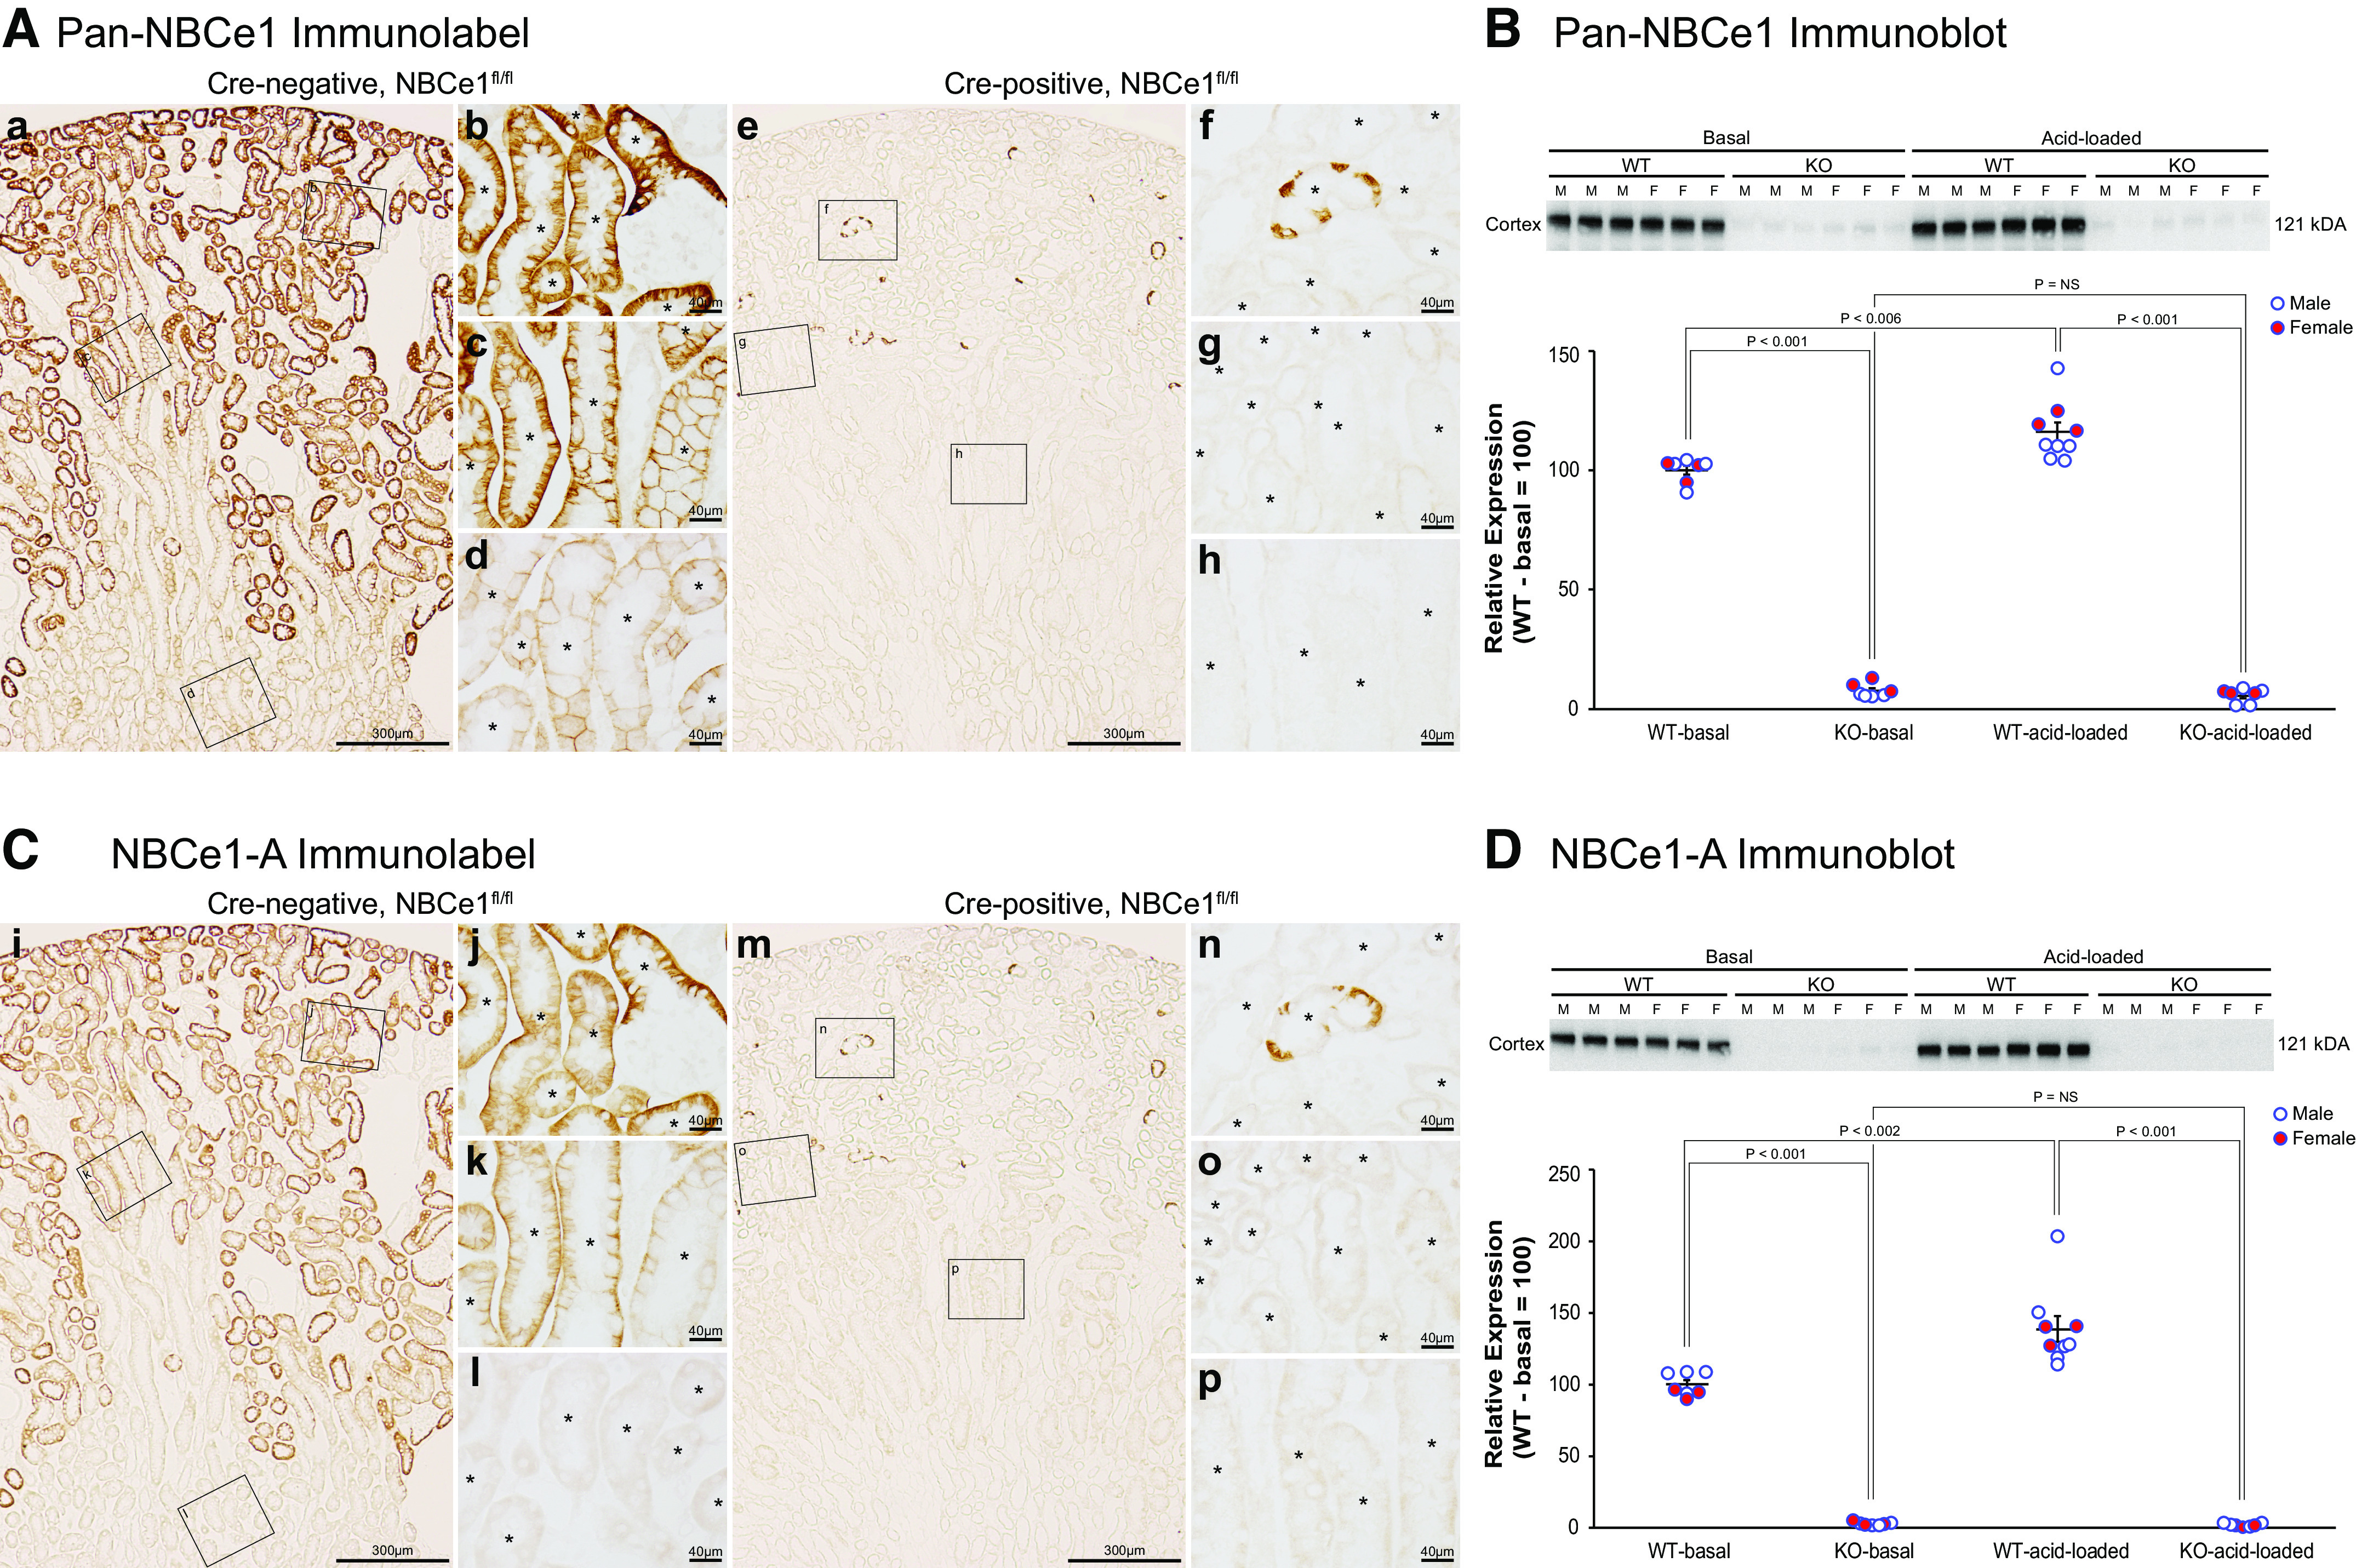
Figure 1.

Demonstration of Na+-bicarbonate cotransporter, electrogenic, isoform 1 (NBCe1) deletion. A: micrographs of pan-NBCe1 immunolabel in Cre-negative and Cre-positive NBCe1fl/fl kidneys. Low-power micrograph (a) and high-power micrographs from the proximal convoluted tubule (PCT; b), proximal straight tubule (PST) in the medullary ray (PST-MR; c), and PST in the outer stripe of the outer medulla (OSOM) (PST-OSOM; d). Basolateral pan-NBCe1 immunolabel was present throughout the proximal tubule. e–h show parallel findings in Cre-positive mice, with the low-power micrograph (e) demonstrating the near-complete absence of pan-NBCe1 immunolabel and high-power micrographs of the PCT (f), PST-MR (g), and PST-OSOM (h) showing the lack of detectable pan-NBCe1 immunolabel in these segments. B: pan-NBCe1 immunoblot demonstrating the near-complete absence of NBCe1 protein in Cre-positive [knockout (KO)] kidneys. C: micrographs demonstrating NBCe1-A immunolabel. i−l: NBCe1-A immunolabel in a control Cre-negative NBCe1fl/fl kidney. Low-power micrograph (i) and high-power micrographs from the PCT (j), PST-MR (k), and PST-OSOM (l). Basolateral NBCe1-A immunolabel was present in cortical proximal tubule segments, PCT (j) and PST-MR (k). NBCe1-A immunolabel was not detectable in the PST-OSOM (l). m–p: findings in Cre-positive NBCe1fl/fl mice. m: low-power micrograph demonstrating the near-complete absence of NBCe1-A immunolabel. High-power micrographs of the PCT (n), PST-MR (o), and PST-OSOM (p), showing the lack of detectable NBCe1-A immunolabel in these segments. Micrographs for Cre-negative mice (a–d and i–l) were taken from serial tissue sections, as were the micrographs for Cre-positive mice (e–h and m–p). D: NBCe1-A immunoblot. Immunohistochemistry micrographs are representative of findings in n = 4 male (M)/4 female (F) mice of each genotype. Immunoblot analysis results are representative of findings in n = 4M/3F mice for each genotype on the basal diet and 6M/3F wild-type (WT) mice and 4M/3F KO mice on the acid diet. Statistical analysis used ANOVA with genotype, diet, and sex as independent variables. Sex did not significantly alter the effects of genotype or diet. P values show results of specific unpaired t test comparisons. NS, not significant. *Proximal tubule segments.
