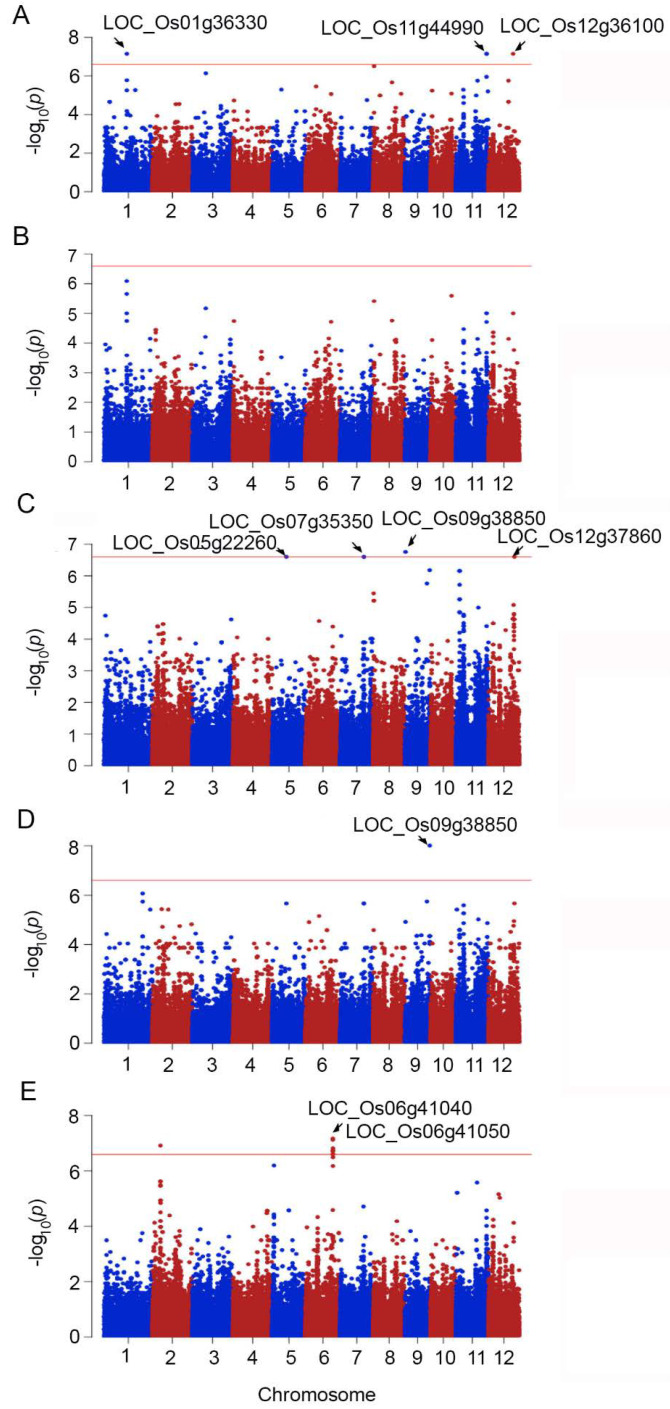
Figure 2.
Manhattan plots demonstrating the genome-wide association between SNPs and salt responsive phenotypes based on shoot fresh weight (SFW) (A), shoot dry weight (SDW) (B), root fresh weight (RFW) (C), root dry weight (RDW) (D), and cell membrane stability (CMS) (E). Some loci with significant SNPs were indicated in Manhattan plots.

