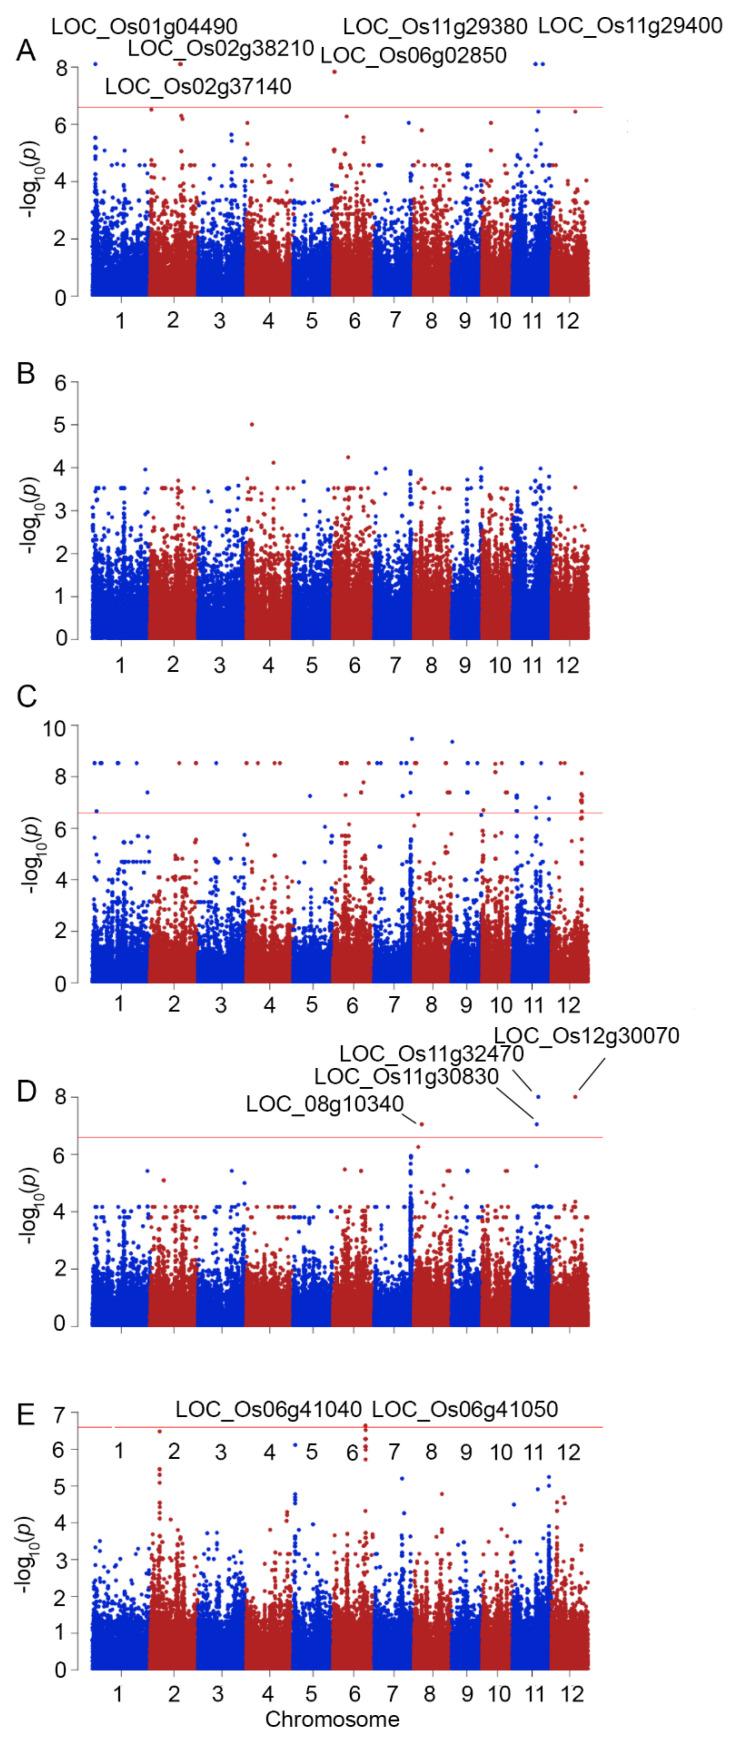
Figure 3.
Manhattan plots demonstrating the genome-wide association between SNPs and stability index of salt responsive phenotypes based on shoot fresh weight (SI_SFW) (A), shoot dry weight (SI_SDW) (B), root fresh weight (SI_RFW) (C), root dry weight (SI_RDW) (D), and cell membrane stability (SI_CMS) (E). Some loci with significant SNPs are indicated in Manhattan plots.

