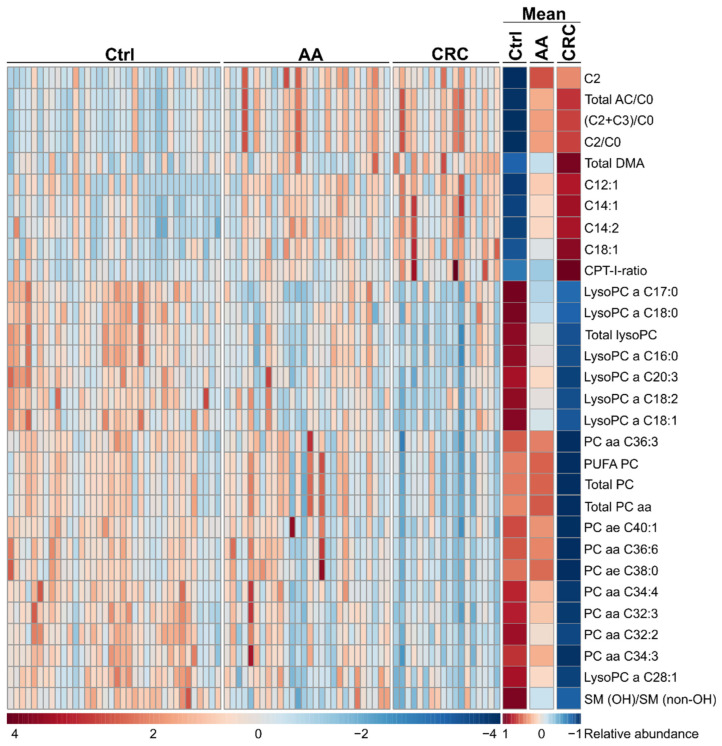
Figure 2.
Heatmap of top 30 features derived from ANOVA for individual patients (left) and group mean averages (right) presented without clustering. AC, acylcarnitine; DMA, dimethylarginine; lysoPC, monoacyl-glycerophosphocholine; PC aa, diacyl-glycerophosphocholine; PC ae, alkyl-acyl-glycerophosphocholine; PUFA, poly-unsaturated fatty acid; SM, sphingomyelin; abundance of each of the metabolites is presented by colour ranging from low (blue) over average (white) to high (red); adapted from MetaboAnalyst 4.0.

