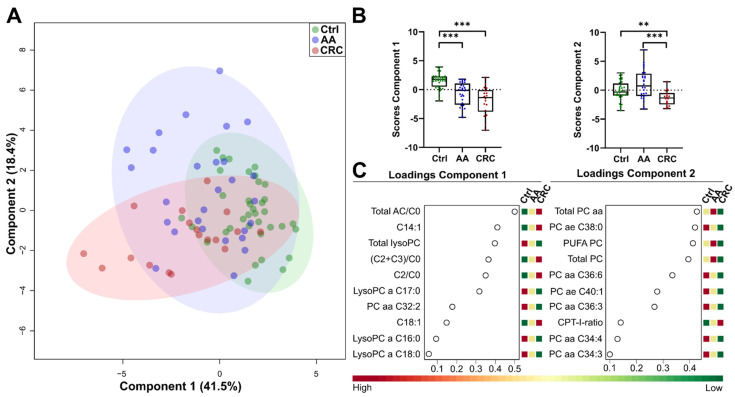
Figure 3.
Sparse partial least discriminant analysis (sPLS-DA) between Control (green), AA (blue) and CRC (red) samples. (A) Score plot including Component 1 and Component 2, circles indicate 95% CI; (B) separation of Control, AA and CRC by the first and second component; (C) loading plot of top 10 features used by Component 1 (left) and Component 2 (right); AC, acylcarnitine; LysoPC, monoacyl-glycerophosphocholine; PC aa, diacyl-glycerophosphocholine; PC ae, alkyl-acyl-glycerophosphocholine; PUFA, poly-unsaturated fatty acid; adapted from MetaboAnalyst 4.0; ** indicates p-values < 0.01, *** p-values < 0.001.

