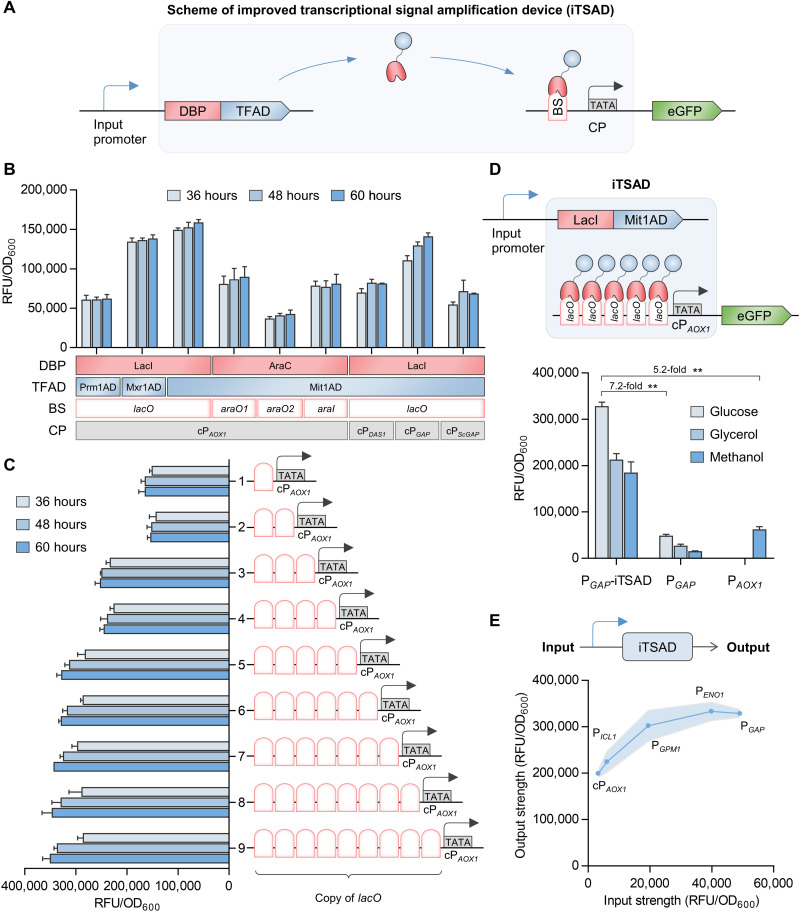
Fig. 1. Design and characterization of an iTSAD.
(A) Genetic circuit scheme of iTSAD. The chimeric transactivator composed of DNA binding proteins (DBPs) and transcription factor activation domains (TFADs) driven by input promoters targets the binding sequences (BS) upstream of the core promoter (CP) and recruits RNA polymerase to activate transcription of the target gene. (B) Function analysis of various biological elements used for the construction of iTSAD. Two DBPs, three TFADs, four BSs, and four CPs were tested in combinations. The combination of LacI-Mit1AD and lacO-cPAOX1 showed the greatest activation effect and was selected for subsequent construction. (C) Effects of lacO copy numbers on the output signal of iTSAD. One to nine copies of lacO were inserted upstream of cPAOX1 driving eGFP expression, and 5lacO-cPAOX1 was selected for subsequent experiments. (D) The eGFP fluorescence intensity of iTSAD with various carbon sources. The output signals of iTSAD driven by PGAP were measured. The most widely used constitutive promoter PGAP and methanol-inducible promoter PAOX1 in P. pastoris were compared. Cells were cultured and compared in glucose, glycerol, and methanol. Statistical significance of eGFP intensity of each strain in specific carbon sources is shown (**P < 0.01). (E) The relationship of input and output signals of iTSAD driven by selective input promoters with different strengths. Input strength, shown on the x axis, represents the evaluation of eGFP expression driven by specific input promoters. Output strength represents eGFP expression driven by iTSAD under specific input promoters. The regression model is shown in fig. S1. RFU, relative fluorescence unit.

