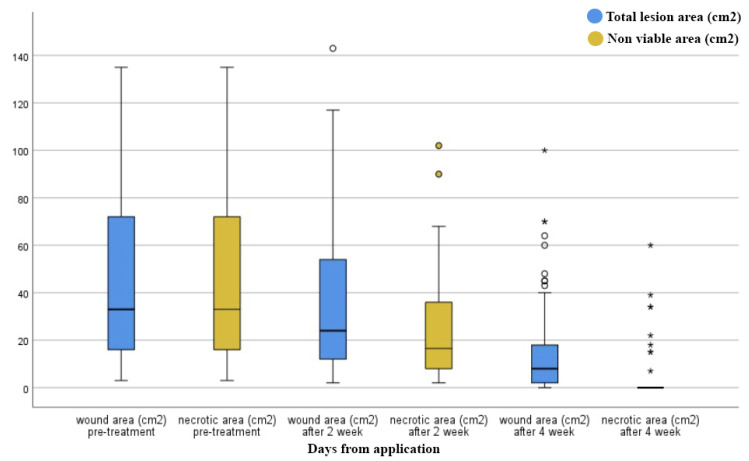
Figure 3.
Box plots representing the evolution of total and necrotic area during the treatment. Boxes represent the 95% confidence intervals, the black line the median value, and whiskers are the lower and upper fence valuce. Circles and asterix identify observations that are smaller than the lower fence or larger than the upper fence.

