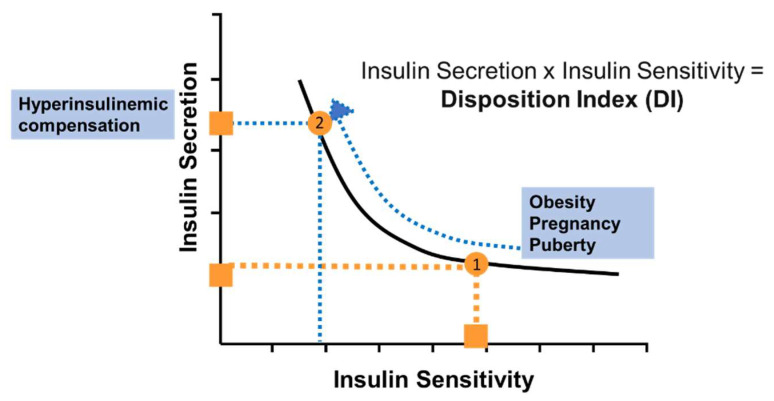
Figure 2.
The “Law of Glucose Tolerance”. It is proposed that there is a hyperbolic relationship between insulin sensitivity and insulin release. Lower insulin sensitivity (insulin resistance) is associated with a greater insulin secretion, such that the product of sensitivity and secretion is a factor termed the “Disposition Index”. A lowering of insulin sensitivity (by increased adiposity, infection, pregnancy for example) would result in move of the orange dot (1) to the left (dotted orange line). However, it is proposed that associated with the reduction in insulin sensitivity would be an increase in beta-cell response. Thus, the trajectory would be represented as a simultaneous increase in insulin response, so the trajectory would be represented by a move along the blue curve to a point on the hyperbola, but on the upper left (2).

