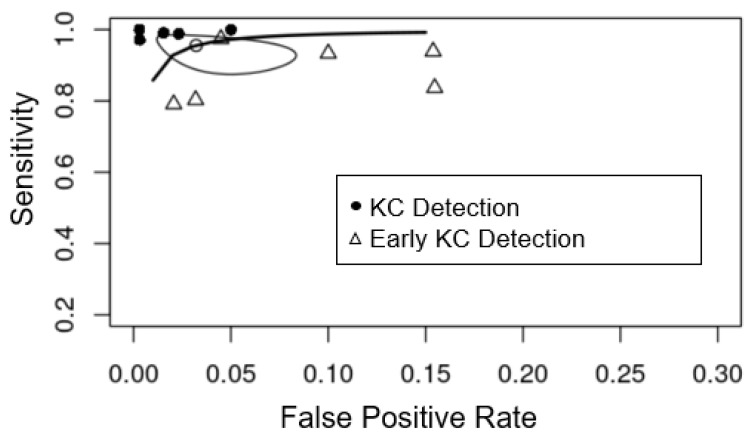
Figure 4.
Summary receiver-operating characteristic curves of the diagnostic performance of machine learning detecting KC (black circle) and early KC (triangle) from controls using Pentacam parameters. The white circle is the summary estimate point (sensitivity (0.956 (95% CI 0.897–0.982), specificity (0.968 (95% CI 0.931–0.985)) of studies using Pentacam parameters. The Y-axis represents sensitivity, with higher values indicating greater sensitivity, and the X-axis represents false positive rate, which was equal to 1-specificity, with lower values indicating greater specificity.

