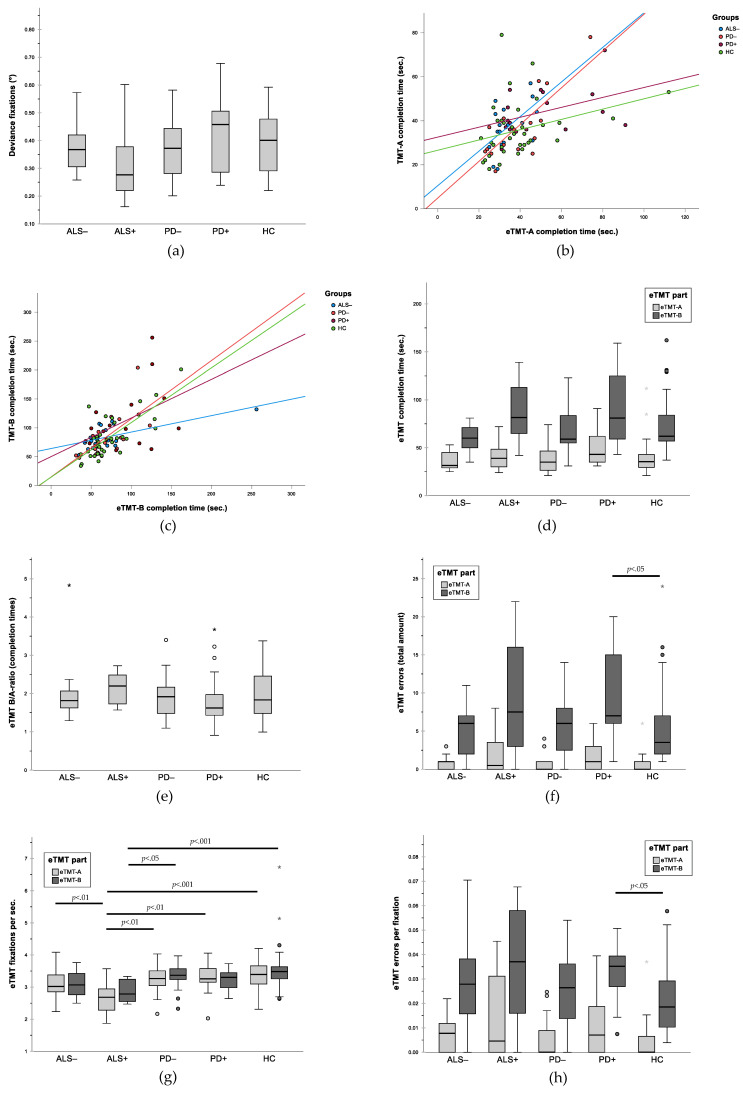
Figure 2.
Group comparisons and correlations for gaze accuracy and performance in TMT and eTMT. (a) Deviance (in degrees) between target and fixation in calibration task as measure of gaze accuracy; (b) correlation between written TMT-A and eTMT-A; (c) correlation between written TMT-B and eTMT-B; (d) completion times for eTMT subtests in comparison between groups; (e) B/A ratio of completion times for eTMT subtests in comparison between groups; (f) total number of errors in eTMT subtests in comparison between groups; (g) fixations per second in eTMT subtests in comparison between groups; (h) errors per fixation in eTMT subtests in comparison between groups. In figures (d–h): ° outliers: values below the first quartile or above the third quartile with a distance of 1.5 to 3 times the interquartile range; * extreme outliers: values below the first quartile or above the third quartile with a distance of more than 3 times the interquartile range.

