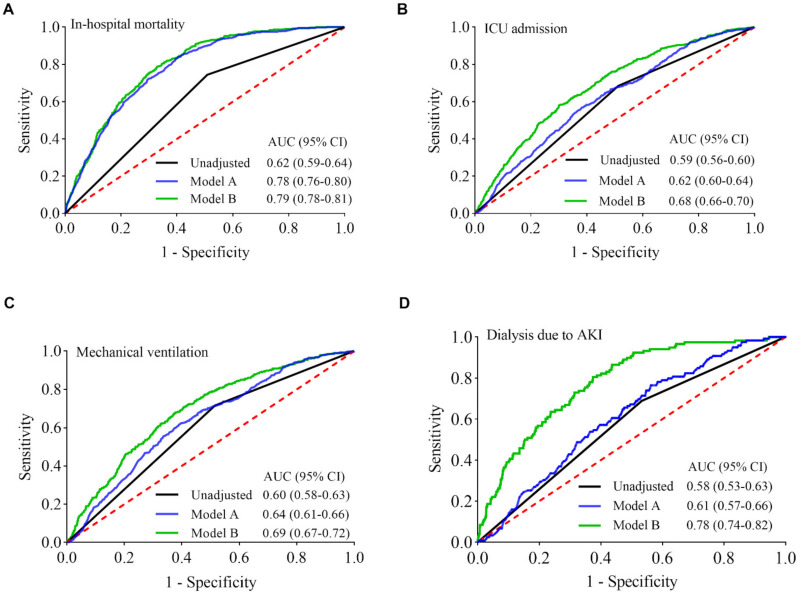
Figure 6.
ROC curves of lymphopenia for predicting risks of the outcomes of interest. The areas under the ROC curves (AUCs) are values for estimating incidences of the outcomes of interest (A–D) through the use of logistic regression function calculated from unadjusted lymphopenia, model A, and model B, respectively. Model A, adjusted for age and gender; Model B, adjusted for age, gender, race, hypertension, diabetes, COPD, chronic kidney disease, coronary artery disease, malignancy, obesity, and smoking. Lymphopenia have the largest AUCs (areas under the green curves) to predict individual risk of adverse clinical outcomes with the incorporation of the known clinical risk factors. AKI, acute kidney injury; CI, confidence interval.

