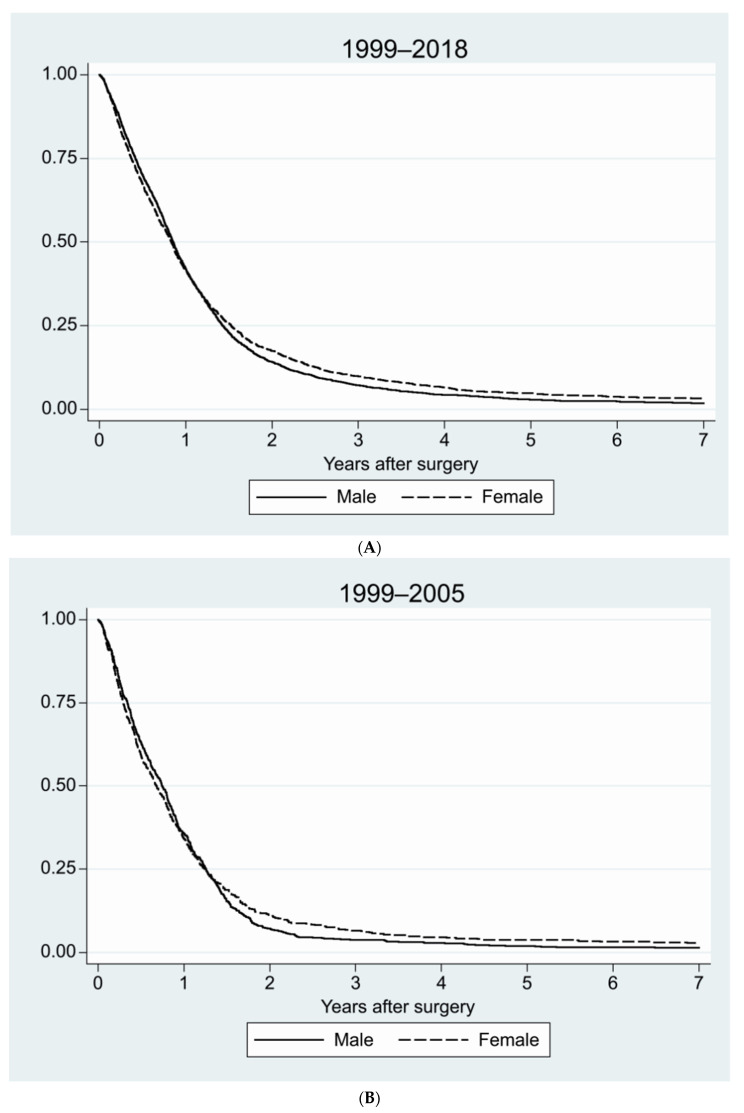
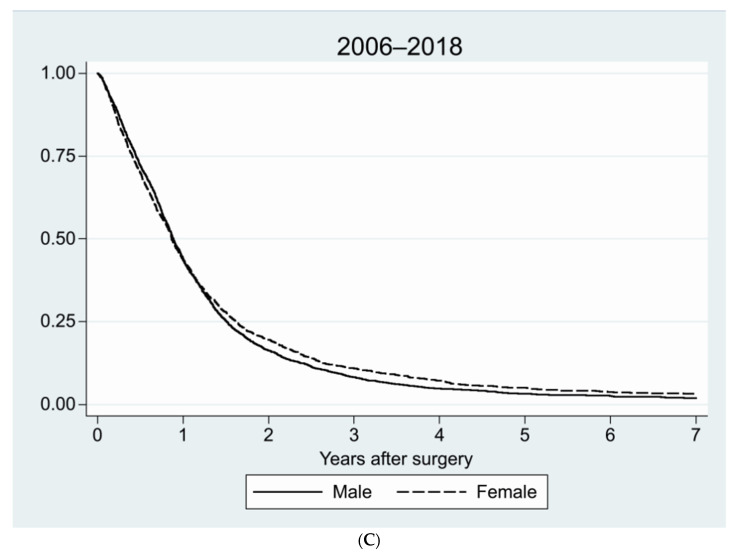
Figure 3.
Survival for men and women for different time periods. (A) For the complete 20-year period from 1999–2018 (p = 0.06); (B) 1999–2005, before temozolomide was introduced into routine treatment (p = 0.35); (C) 2006–2018, after the introduction of concomitant radio-chemotherapy with temozolomide (p = 0.10), using Kaplan–Meier survival curves.


