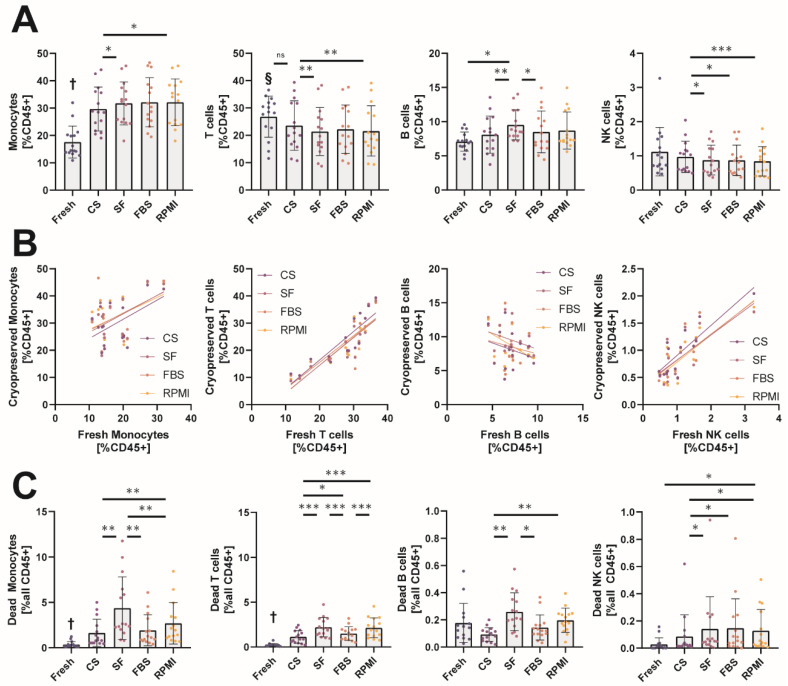
Figure 2.
Cryopreservation alters the relative distribution of leukocyte populations. (A) Relative number of gated monocytes, T cells, B cells, and NK cells before and after cryopreservation analyzed by flow cytometry. Cell amounts are given as % live CD45+ cells. (B) Correlation plots of relative cell amounts of monocytes, T cells, B cells, and NK cells before and after cryopreservation. Correlation was analyzed by linear regression. (C) Analysis of dead monocytes, T cells, B cells, and NK cells before and after cryopreservation. Please notice the different scales on the y-axis of the two left and two right panels. Gated cells staining positive for intracellular SytoxGreen are shown relative to all CD45+ cells measured by flow cytometry. * p < 0.05; ** p < 0.01; *** p < 0.001; † = significantly different from all other conditions; § = significantly different from other conditions except the ones indicated with “ns”. (n = 15 individual human donors).

