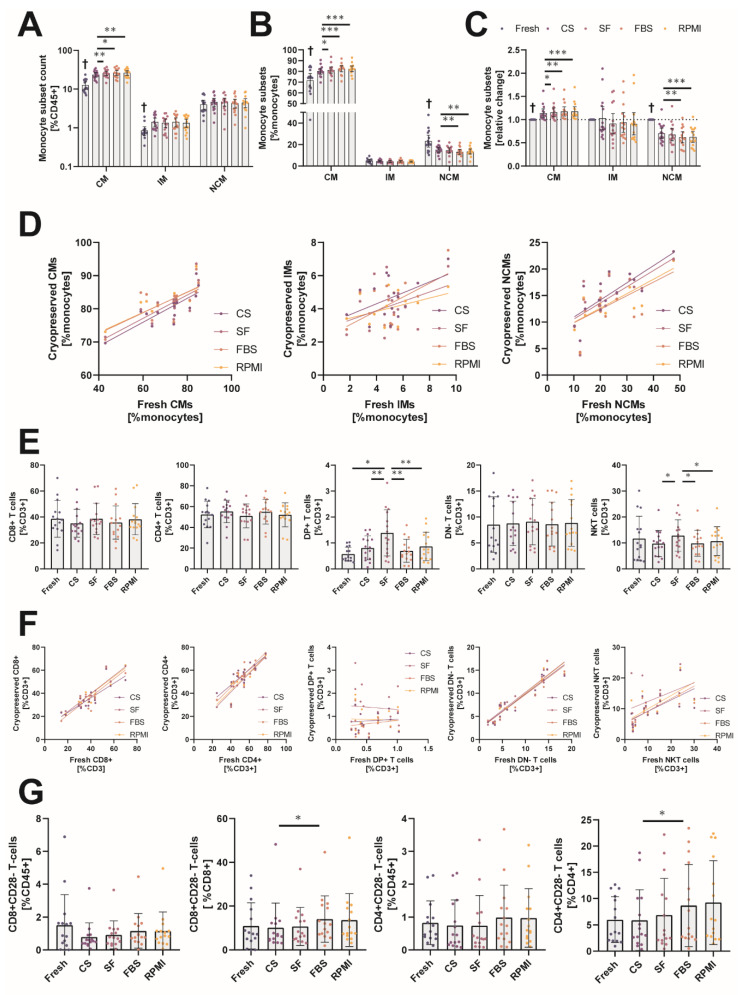
Figure 3.
Analysis of the effect of cryopreservation media on the relative frequency of individual leukocyte subsets. (A) Relative amount of gated monocyte subsets relative to all live CD45+ cells analyzed by flow cytometry. CM = classical monocytes, IM = intermediate monocytes, NCM = non-classical monocytes. (B) Relative distribution of the individual monocyte subsets analyzed by flow cytometry. (C) Relative change in monocyte subset distribution before and after cryopreservation; >1 indicates a relative overrepresentation of a subset, <1 indicates a relative underrepresentation. (D) Correlation plots of relative monocyte subset distribution before and after cryopreservation. Correlation was analyzed by linear regression. (E) Relative amount of different T cell subsets relative to all live CD3+ T cells analyzed by flow cytometry. DP+ = double positive (CD4+, CD8+). DN- = double negative (CD4-, CD8-). (F) Correlation plots of different T cell subsets before and after cryopreservation. Correlation was analyzed by linear regression. (G) Relative amount of gated CD28- T cell subsets relative to all live CD45+ cells or to CD4/CD8+ cells analyzed by flow cytometry. * p < 0.05; ** p < 0.01; *** p < 0.001; † = significantly different from all other conditions. (n = 15 individual human donors).

