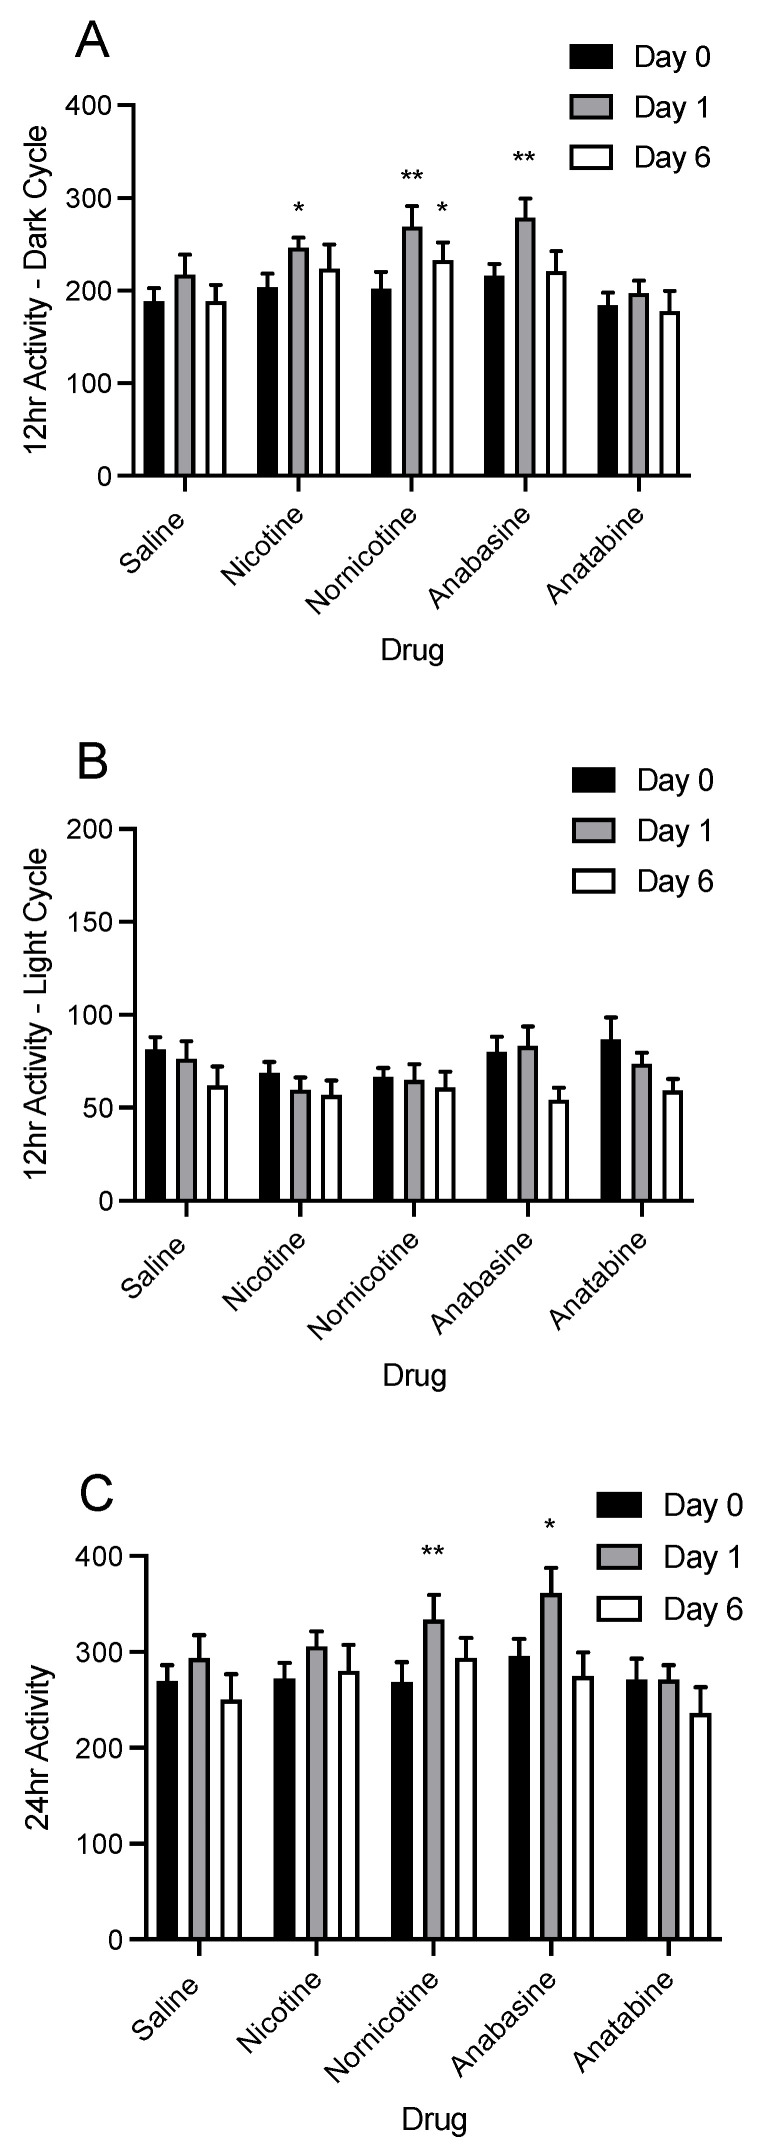
Figure 5.
Mean (±S.E.M.) of changes in physical activity during the dark (panel A) and light (panel B) cycles, as well as the full 24 h period (panel C), for the final day of baseline (day 0), and days 1 of 6 of treatment injections of saline (n = 8), nicotine (n = 10), nornicotine (n = 10), anabasine (n = 10), or anatabine (n = 10). * p < 0.05, ** p < 0.01 difference from baseline activity (day 0) at the indicated day.

