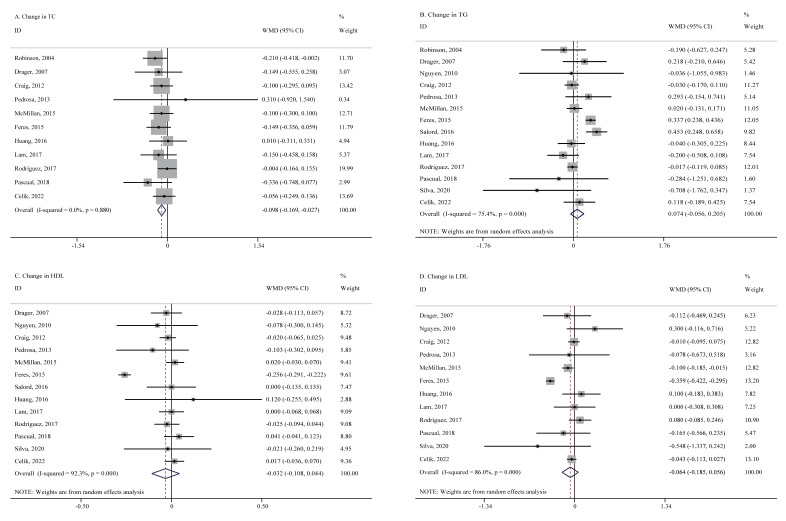
Figure 2.
Forest plots for changes in lipid profiles after CPAP treatment. CPAP = continuous positive airway pressure, HDL = high-density lipoprotein, LDL = low-density lipoprotein, TC = total cholesterol, TG = triglyceride, WMD = weighted mean difference. Panel (A) Change in TC. Panel (B) Change in TG. Panel (C) Change in HDL. Panel (D) Change in LDL.

