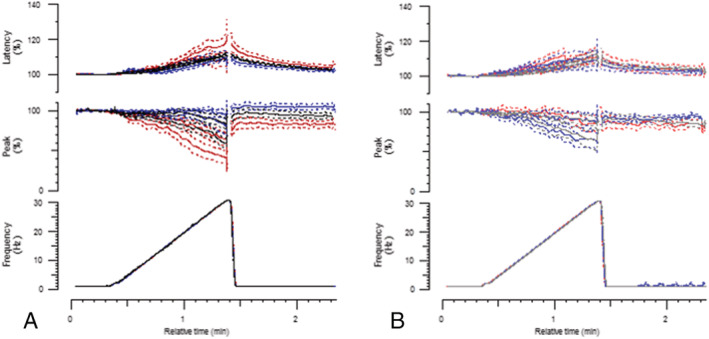
Figure 4.

Response of WT and Draggen TA to in vivo 30‐Hz frequency ramp by age. (A) Response of WT TA to 30‐Hz frequency ramp. Young (black, n = 22), middle‐aged (blue, n = 13) and old (red, n = 14) mice. (B) Response of Draggen TA to 30‐Hz frequency ramp. Young (grey, n = 15), middle‐aged (light blue, n = 8) and old (light red, n = 9) mice. The change in latency (time from stimulus to peak of response) is plotted on the top row as a percentage change from baseline latency. The change in amplitude of response is plotted on the middle row as a percentage change from baseline amplitude of response. During the frequency ramp (shown on bottom row), the percentage change in response to both the first and last stimuli in the train are shown. The baseline is the mean latency and amplitude of response during the period of 0.5‐Hz stimulation that precedes the frequency ramp. ***P < 0.005, ****P < 0.0001.
