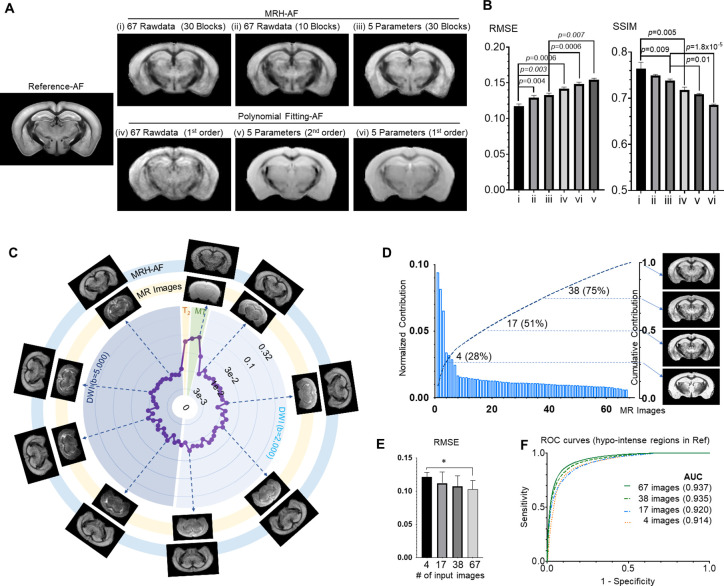
Figure 2. Understanding how multi-contrast magnetic resonance imaging (MRI) input influences the performance of MRH auto-fluorescence (MRH-AF).
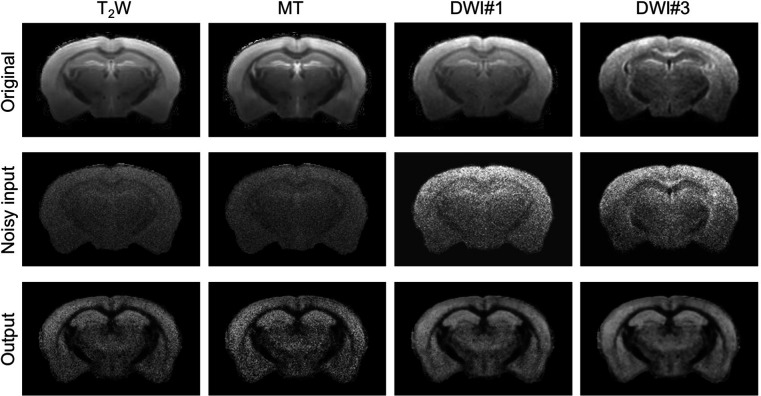
(A) MRH-AF results generated under different conditions (top panel) compared to polynomial fitting results (lower panel). (B) Root mean square error (RMSEs) and structural similarity indices (SSIMs) of the predicted AF maps shown in A with respect to the reference AF map. (C) Plots of the relative contribution of individual MRI images, normalized by the total contribution of all MR images, measured by RMSE. Images displayed on the outer ring (light blue, MRH-AF) show the network outcomes after adding 10% random noises to a specific MR image on the inner ring (light yellow). (D) The relative contributions of all 67 MR images arranged in descending order and their cumulative contribution. The images on the right show the MRH-AF results with the network trained using only the top 4, 17, 38, and all images as inputs. (E) RMSE measurements of images in D(n = 4) with respect to the reference AF data. Lower RMSE values indicate better image quality. * indicates statistically significant difference (p = 0.028, t-test). (F) Receiver operating characteristic (ROC) curves of MRH-AF results in D and the area under the curve (AUC) values.


