. 2022 Feb 11;11:e70684. doi: 10.7554/eLife.70684

Figure 1. L. plantarum can reduce both Fe3+ and an anode through EET.

(A) Reduction of Fe3+ (ferrihydrite) to Fe2+ by L. plantarum NCIMB8826 after growth in mMRS. The assays were performed in PBS supplemented with 20 µg/mL DHNA and/or 55 mM mannitol. Fe2+ was detected colorimetrically using 2 mM ferrozine. For L. plantarum inactivation, cells were incubated at 85℃ in PBS for 30 min prior to the assay. Significant differences were determined by one-way ANOVA with Tukey’s post-hoc test (n = 3), *** p < 0.001. (B) Two-chambered electrochemical cell setup for measuring current generated by L. plantarum. (C) Current density production over time by L. plantarum in CDM supplemented with 20 µg/mL DHNA and/or 110 mM mannitol. The anode was polarized at +0.2VAg/AgCl. The avg ± stdev of three biological replicates is shown. See also Figure 1—figure supplement 1 and Figure 1—figure supplement 2 and related data in Figure 1—source data 1.

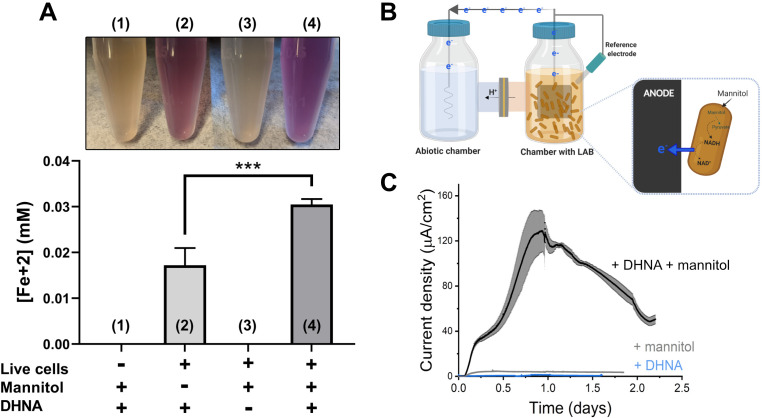
Figure 1—source data 1. Raw data of Figure 1A and B.
elife-70684-fig1-data1.xlsx (618.1KB, xlsx)

Figure 1.

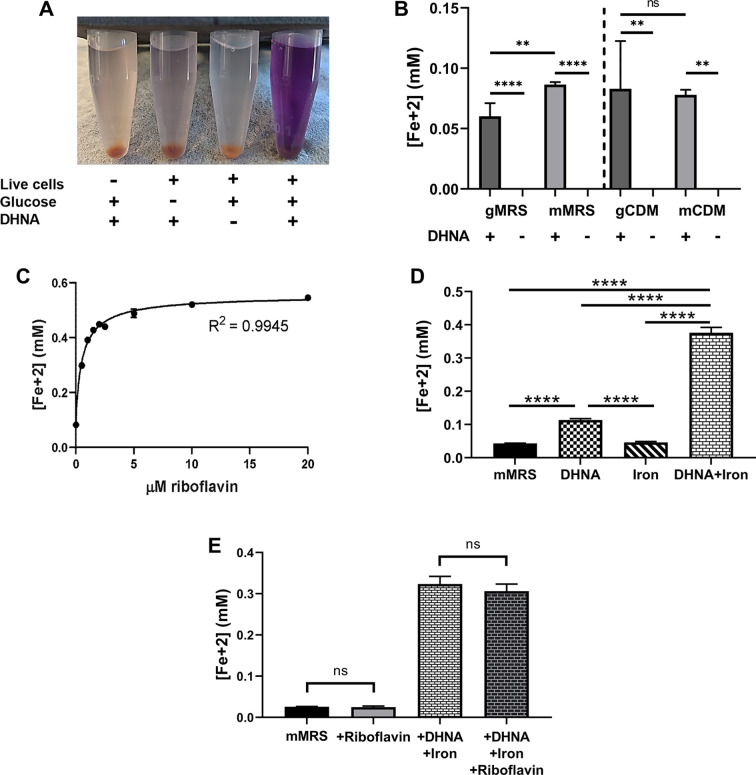
Figure 1—figure supplement 1. Iron reduction by L. plantarum is dependent upon DHNA, carbon source, and riboflavin.

Figure 1—figure supplement 1.

(A) Reduction of Fe3+ (ferrihydrite) to Fe2+ by L. plantarum NCIMB8826 after growth in MRS with glucose (gMRS). The assays were performed in PBS supplemented with 20 µg/mL DHNA and/or 55 mM glucose. For L. plantarum inactivation, cells were incubated at 85℃ in PBS for 30 min prior to the assay. (B) Reduction of ferrihydrite by L. plantarum after growth in MRS with glucose (gMRS) or mannitol (mMRS) or CDM with glucose (gCDM) or mannitol (mCDM). The ferrihydrite reduction assays were performed in PBS supplemented with 20 µg/mL DHNA and the corresponding carbon source (55 mM glucose or mannitol). (C) Reduction of ferrihydrite by L. plantarum in the presence of 20 μg/mL DHNA, 55 mM mannitol, and increasing concentrations of riboflavin. (D and E) Reduction of ferrihydrite by L. plantarum after growth to mid-exponential phase in mMRS with or without the supplementation of 20 μg/mL DHNA, iron (1.25 mM ferric ammonium citrate), and/or 2.5 μM riboflavin. Significant differences in iron reduction were determined by one-way ANOVA with Tukey’s post-hoc test (n = 3), ** p < 0.01; **** p < 0.0001. The avg± stdev of three biological replicates is shown. See related data in Figure 1—figure supplement 1—source data 1.
Figure 1—figure supplement 1—source data 1. Raw data of Figure 1—figure supplement 1A-F.
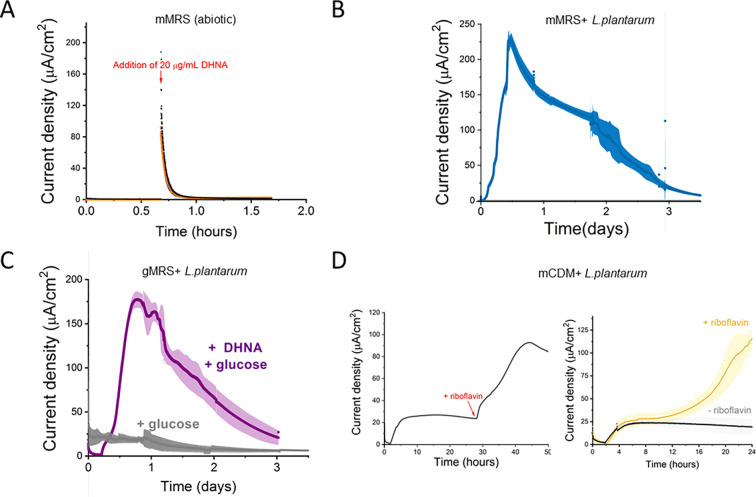
Figure 1—figure supplement 2. Current production by L. plantarum is a biotic process dependent on DHNA, carbon source, and riboflavin.

Figure 1—figure supplement 2.

(A) Abiotic current density response in bioelectrochemical reactors over time in mannitol-containing MRS (mMRS) upon DHNA (20 μg/mL) addition. Current density produced by L. plantarum in (B) mMRS with 20 μg/mL DHNA or (C) gMRS with 20 μg/mL DHNA. (D) Effect of riboflavin addition on current density production by L. plantarum in mannitol-containing CDM (mCDM) with 20 μg/mL DHNA. The avg± stdev of three biological replicates is shown. See related data in Figure 1—figure supplement 2—source data 1.
Figure 1—figure supplement 2—source data 1. Raw data of Figure 1—figure supplement 2A-D.
Figure 1—figure supplement 3. A sub-physiological concentration of DHNA stimulates EET in L. plantarum.

Figure 1—figure supplement 3.

Reduction of Fe3+ (iron III oxide nanoparticle, primarily γ-Fe2O3) to Fe2+ (A) and current production (B) by L. plantarum when 0.01 μg/mL DHNA was supplied. (C) pH measurements at 0 and 56 hr for the experiment shown in (B). The avg± stdev is shown. Three replicates for (A) and two replicates for (B) and (C). Significant differences were determined by two-tailed t-test, **p ≤ 0.01. See related data in Figure 1—figure supplement 3—source data 1.
Figure 1—figure supplement 3—source data 1. Raw data of Figure 1—figure supplement 3A-C.