. 2022 Feb 11;11:e70684. doi: 10.7554/eLife.70684

Figure 2. The FLEET genes ndh2 and pplA are associated with iron reduction by LAB.

(A) Heatmap showing the genera in the Lactobacillales order containing FLEET genes. Homology searches were conducted using tBLASTx for 1788 complete LAB genomes in NCBI (downloaded 02/25/2021) against the L. plantarum NCIMB8826 FLEET locus. A match was considered positive with a Bit-score >50 and an E-value of <10–3. Arrows designate genera tested for iron reduction activity; green = EET-active with Fe3+, red = EET-inactive with Fe3+. (B) Reduction of ferrihydrite in PBS with 20 μg/mL DHNA and 55 mM mannitol after growth in mMRS supplemented with 20 μg/mL DHNA and 1.25 mM ferric ammonium citrate. The avg ± stdev of three biological replicates per strain is shown. (C) Relative expression of NCIMB8826 FLEET locus genes in mMRS with 20 μg/mL DHNA and 1.25 mM ferric ammonium citrate compared to growth in mMRS. Significant differences in expression were determined by the Wald test (n = 3) with a Log2 (fold change) > 0.5 and an FDR-adjusted p-value of <0.05. See also Figure 2—figure supplement 1 and Figure 2—figure supplement 2 and related data in Figure 2—source data 1.

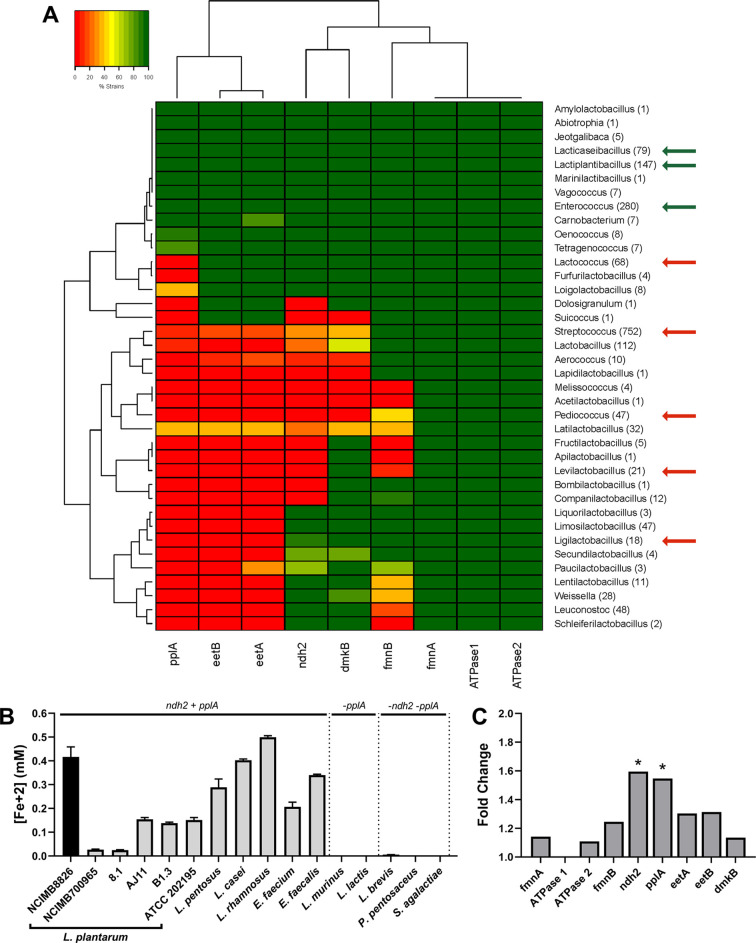
Figure 2—source data 1. EET locus homology matches at genus level via tBLASTx from complete Lactobacillales genome dataset for Figure 2A, raw data for Figure 2B and relative expression data of Figure 2C.

Figure 2.

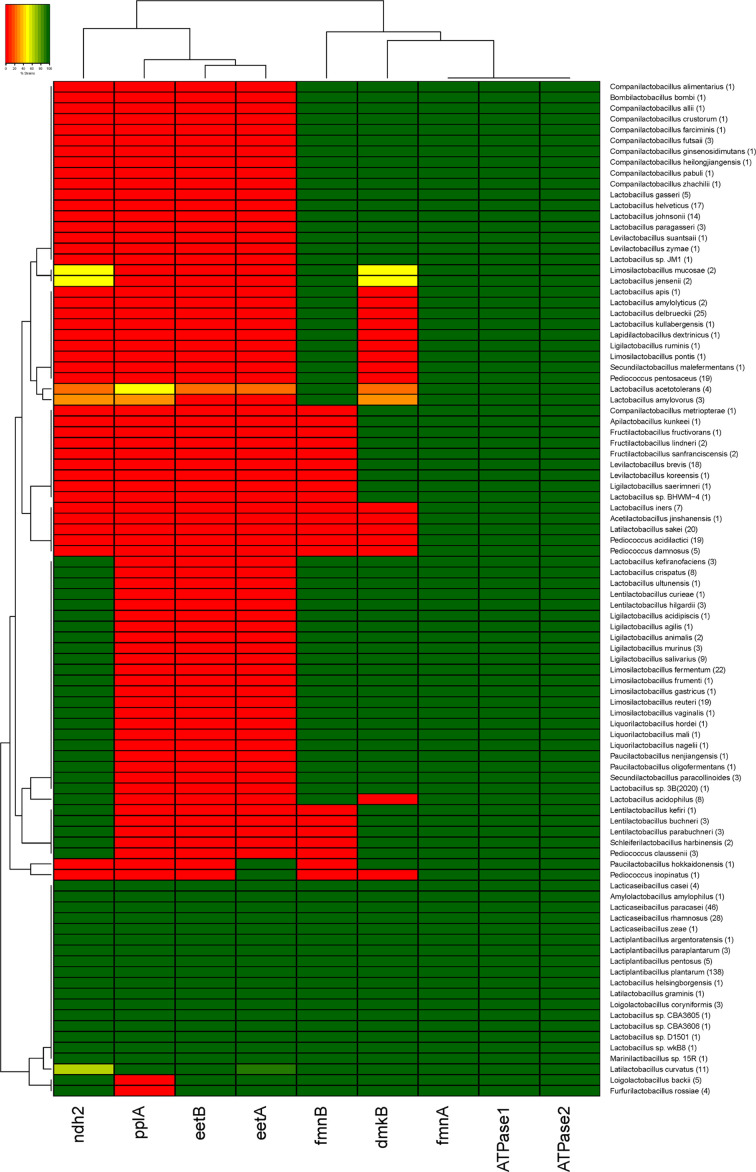
Figure 2—figure supplement 1. Conservation of FLEET locus genes among lactobacilli.

Figure 2—figure supplement 1.

Heatmap showing the bacteria in the Lactobacillus-genus complex containing genes in the FLEET locus. Homology searches were conducted using tBLASTx for 1788 complete LAB genomes in NCBI (downloaded 02/25/2021) against the L. plantarum NCIMB8826 FLEET locus. A match was considered positive with a Bit-score >50 and an E-value of <10–3. See related data in Figure 2—figure supplement 1—source data 1.
Figure 2—figure supplement 1—source data 1. EET locus homology dataset of Figure 2—figure supplement 1.
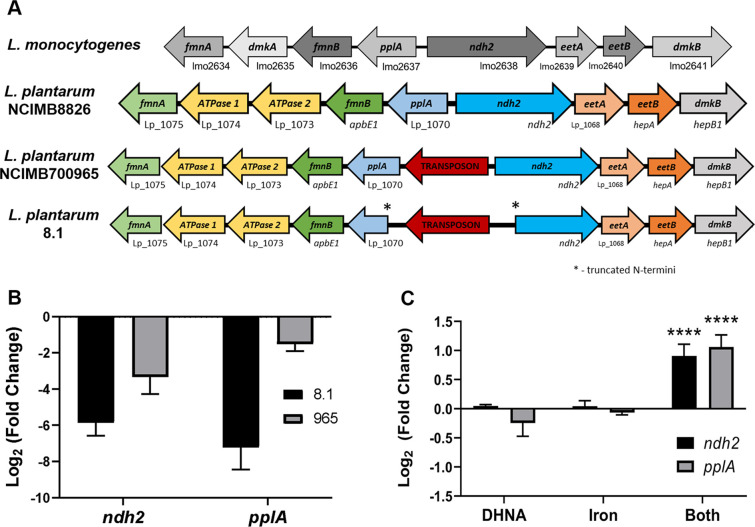
Figure 2—figure supplement 2. ndh2 and pplA are required for iron reduction through EET.

Figure 2—figure supplement 2.

(A) Visualization of the FLEET locus in L. monocytogenes and three strains of L. plantarum. Genes are annotated based on predicted functions within the FLEET system. (B) Relative expression of ndh2 and pplA in L. plantarum strains 8.1 and NCIMB700965 (“965”) during growth in MRS compared to L. plantarum NCIMB8826. The avg± stdev of three biological replicates is shown. (C) Relative expression of ndh2 and pplA in L. plantarum during growth in mMRS containing 20 μg/mL DHNA, iron (1.25 ferric ammonium citrate), or both (DHNA and iron), compared to during growth in mMRS. Significant differences determined through Two-way ANOVA with Sidak’s post-hoc test (n = 3), **** p < 0.0001. See related data in Figure 2—figure supplement 2—source data 1.
Figure 2—figure supplement 2—source data 1. Relative expression dataset of Figure 2—figure supplement 2.