. 2022 Feb 11;11:e70684. doi: 10.7554/eLife.70684

Figure 3. L. plantarum requires ndh2 and conditionally pplA for EET.

(A) Reduction of Fe3+ (ferrihydrite) to Fe2+ with wild-type L. plantarum or EET deletion mutants in the presence of 20 μg/mL DHNA and 55 mM mannitol after growth in mMRS supplemented with 20 μg/mL DHNA and 1.25 mM ferric ammonium citrate. Significant differences determined by one-way ANOVA with Dunnett’s post-hoc test, **** p < 0.0001. (B) Redox potential of mMRS supplemented with 20 μg/mL DHNA and 1.25 mM ferric ammonium citrate after inoculation with wild-type L. plantarum or EET deletion mutants. Significant ORP differences between the wild-type and mutant strains determined by two-way RM ANOVA with Tukey’s post-hoc test, * p < 0.05 (WT vs. Δndh2); # p < 0.05 (WT vs. ΔpplA). (C) Current density generated by wild-type L. plantarum and deletion mutants in mCDM supplemented with 20 μg/mL DHNA. The avg ± stdev is shown. (D) Current density generated by L. plantarum and two L. lactis strains lacking pplA in mCDM. For L. plantarum, the mCDM was supplemented with 20 μg/mL DHNA. The data correspond to the average of two (D) or three (A to C) biological replicates per strain. See also Figure 3—figure supplement 1 and Figure 3—figure supplement 2 and related data in Figure 3—source data 1.

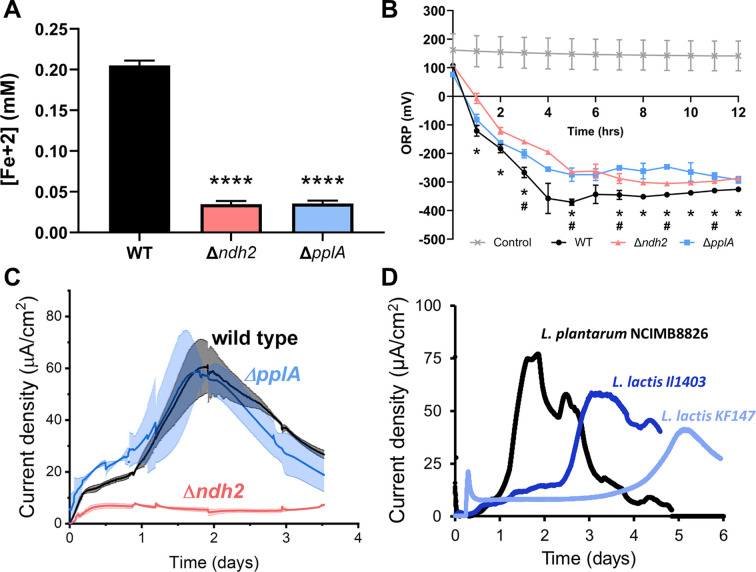
Figure 3—source data 1. Raw data of Figure 3A–C.

Figure 3.

Figure 3—figure supplement 1. Impact of ndh2 and pplA deletion on growth, iron reduction, current density, and metabolites production.

Figure 3—figure supplement 1.

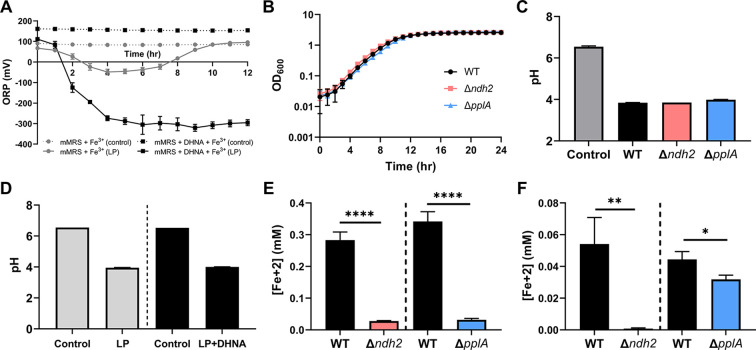
(A) Redox potential of mMRS supplemented with 1.25 mM ferric ammonium citrate after inoculation with wild-type L. plantarum. Where indicated, 20 μg/mL DHNA was supplemented as well. (B) Growth of wild-type L. plantarum, Δndh2, or ΔpplA in mMRS supplemented with 20 μg/mL DHNA and 1.25 mM ferric ammonium citrate. (C) Final pH from Figure 3B. (D) Final pH from Figure 3—figure supplement 1A. (E and F) Reduction of ferrihydrite by L. plantarum or FLEET deletion mutants from Figure 3B in the ferrihydrite reduction assay at (E) ΔmVmax ( ~ 5 hr) or (F) stationary phase (12 hr). Significant differences determined through Two-tailed t-test (n = 3), * p < 0.05; ** p < 0.01; **** p < 0.0001. The avg ± stdev of three biological replicates is shown. See related data in Figure 3—figure supplement 1—source data 1.
Figure 3—figure supplement 1—source data 1. Raw data of Figure 3—figure supplement 1A-F.
Figure 3—figure supplement 2. Impact of ndh2 and pplA deletion on maximum current density, pH and metabolites production.

Figure 3—figure supplement 2.

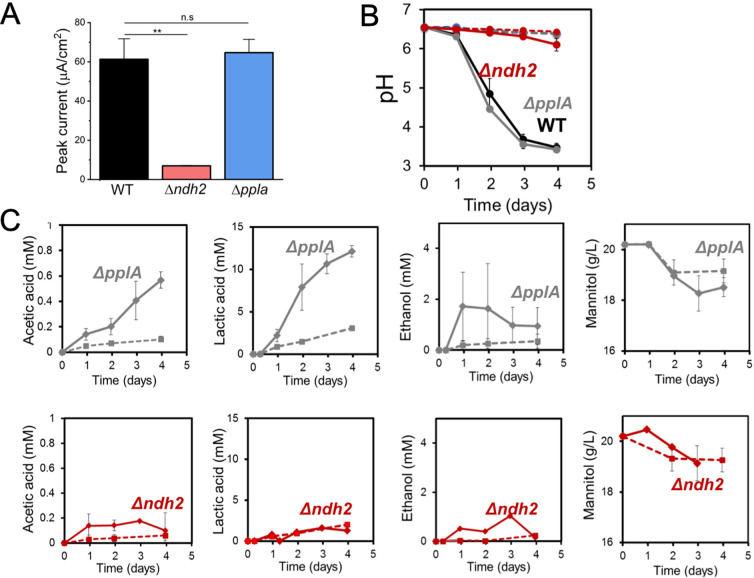
(A) Peak current generated by wild-type L. plantarum or either the Δndh2 or ΔpplA mutant from Figure 3C. (B) pH measurements and (C) metabolites produced in the bioelectrochemical reactors inoculated with wild-type L. plantarum or either the Δndh2 or ΔpplA mutant from Figure 3C. Solid lines denote the presence of an anode polarized to +0.2 V (vs Ag/AgCl sat. KCl) while dashed lines denote open circuit conditions. See related data in Figure 3—figure supplement 2—source data 1.
Figure 3—figure supplement 2—source data 1. Raw data of Figure 3—figure supplement 2A-C.