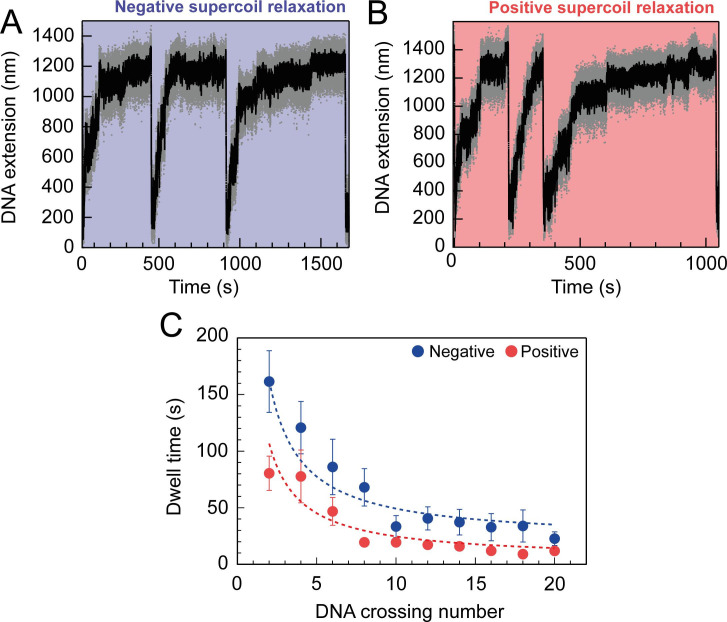
Figure 2. Topo VI relaxation rate depend on the level of DNA supercoiling.
(A) An example trace of 0.75 nM topo VI fully relaxing negative supercoils in a 5 kb DNA duplex at a force of 0.4 pN, at 21 °C. DNA extension is plotted against time. The abrupt decreases in extension correspond to rapid DNA supercoiling by rotating the magnets. The slower DNA extension increases correspond to topo VI-dependent supercoil relaxation activity. Data collected at 200 Hz (grey dots) and with a 1-second Savitzky–Golay smoothing filter (black line)( B) same as in A, aside from the DNA being positively supercoiled. (C) Dwell time (± SEM) between topo VI-dependent strand-passage events on positive (N dwell times across all data points = 212) and negative (N dwell times across all data points = 146) supercoils, plotted against the level of DNA supercoiling. Data were fitted to an inverse function, where the time taken for topo VI to perform a strand-passage reaction is inversely proportional to the number of DNA crossings present in the substrate. Raw data (A and B) were analysed in IgorPro 7 (WaveMentrics) using a T-test based method, first described in Seol et al., 2016.

