Figure 4. Topo VI activity on braided DNA substrates.
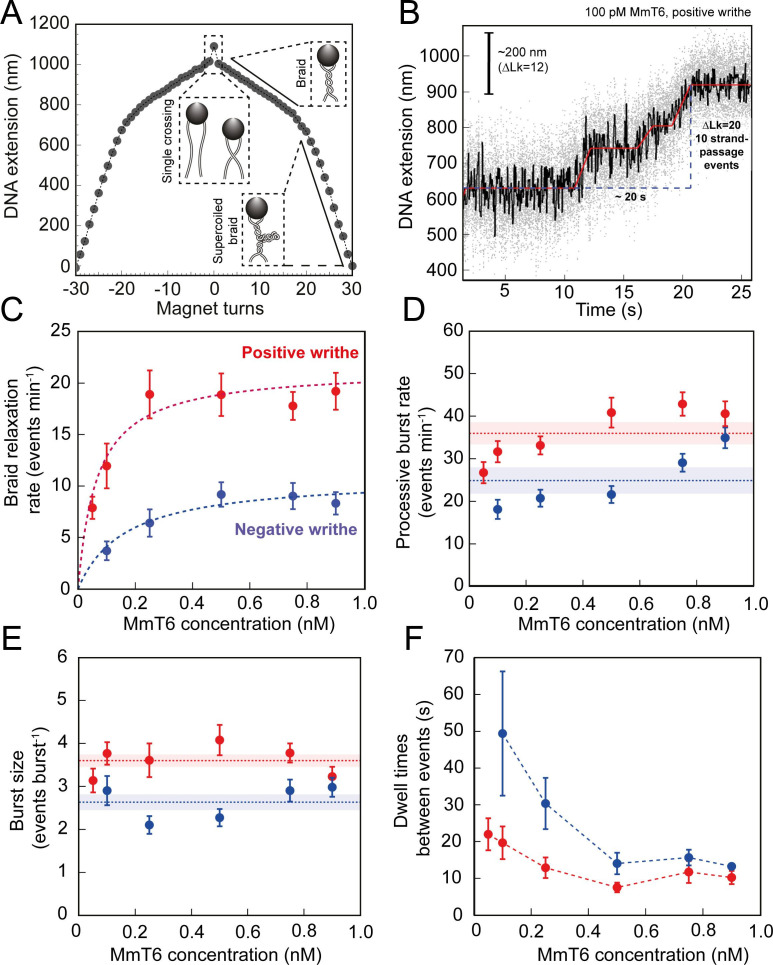
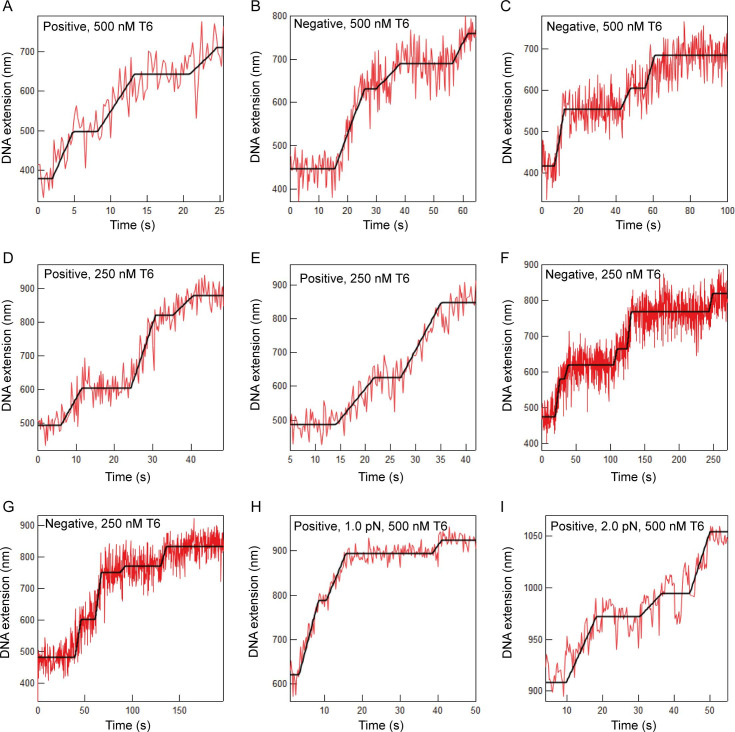
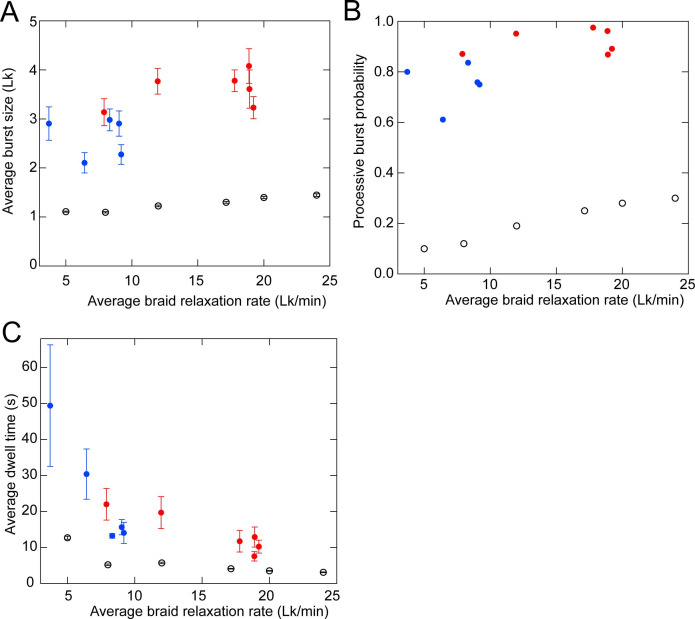
(A) Calibration curve for a DNA braid formed from two 5 kb DNA duplexes tethered to a single magnetic bead. DNA extension is plotted as a function of magnet turns. Negative magnet-turn values represent the right-handed rotation of the magnets producing negative writhe, and positive magnet-turn values represent the generation of positive writhe via left-handed magnet rotation. (Note: this is the reverse scenario of forming a plectoneme, see Figure 1A). The first positive or negative 360° turn results in a sharp decrease in DNA extension as a single crossing is input. This is followed by a gradual decrease in extension with rotation, representing the formation of a DNA braid. At a critical number of turns, the braid buckles upon itself to form a supercoiled braid, which is evident in the graph as a switch to a steeper gradient. (B) An example of raw magnetic tweezers data, showing topo VI relaxation activity on a DNA braid with positive chirality. Data collected at a force of 0.5 pN, at 21 °C, using 0.1 nM topo VI and 1 mM ATP. Scale bar (black) represents ΔLk of 12, which corresponds to a change in DNA extension of 200 nm. A total of 10 DNA crossings are relaxed by topo VI in ~20 s (blue dashed line), measured as the time between the imposition and complete relaxation of the braids. Data collected at 200 Hz (grey dots) and plotted with a 1 second Savitzky–Golay smoothing filter (black line) and the T-test fit in red (Seol et al., 2016). Additional examples of braid relaxation data and the T-test fits are provided in Figure 4—figure supplement 1. (C) The average rate of topo VI braid unlinking activity (± SEM), of both positive (N tethers across all data points = 92) and negative (N tethers across all data points = 55) braids, measured as the number of strand-passage events/min and plotted as a function of topo VI concentration (0.05–0.9 nM). Data were fitted to a Michaelis-Menten-like function (). (D) The processive burst rate of topo VI (± SEM) on both positive (N burst events across all data points = 206) and negative (N burst events across all data points = 104) braids, measured as the average number of events min–1 in a burst, and plotted as a function of topo VI concentration. A burst is defined as rapid topo VI activity corresponding to the passage of two or more consecutive T-segments in which individual strand-passage events cannot be discerned by the step-finder. Any single strand-passage events detected were omitted from the average. The horizontal dashed lines represent the average processive burst rate (± SEM) across all concentrations of topo VI assayed. (E) The average burst size of topo VI (± SEM) on both positive (N burst events across all data points = 217) and negative (N burst events across all data points = 132) braids, measured as the average number of strand-passage events per burst, plotted as a function of topo VI concentration. Single passage events were included in the average burst size. The horizontal dashed lines represent the average processive burst size (± SEM) across all concentrations of topo VI assayed. (F) The dwell times between processive bursts of topo VI activity on both positive (N dwell times across all data points = 156) and negative (N dwell times across all data points = 119) braids, plotted as a function of topo VI concentration. A dwell time is defined as a period of time in which the DNA extension remains constant, reflecting lack of topo VI-dependent braid unlinking activity. In C-F, data was collected at a force of 0.5 pN, at 21 °C, using 1 mM ATP, with topo VI activity on positive DNA braids in red, and in blue for negative DNA braids. Raw data were analysed in IgorPro 7 (WaveMentrics) using a T-test-based method, first described in Seol et al., 2016. Figure 4—figure supplement 2 provides a comparison between the analysis of the experimental braid relaxation data and the analysis of simulated purely distributive braid relaxation data. Figure 4—figure supplement 3 provides examples of the t-test based fitting of the simulated data sets.


