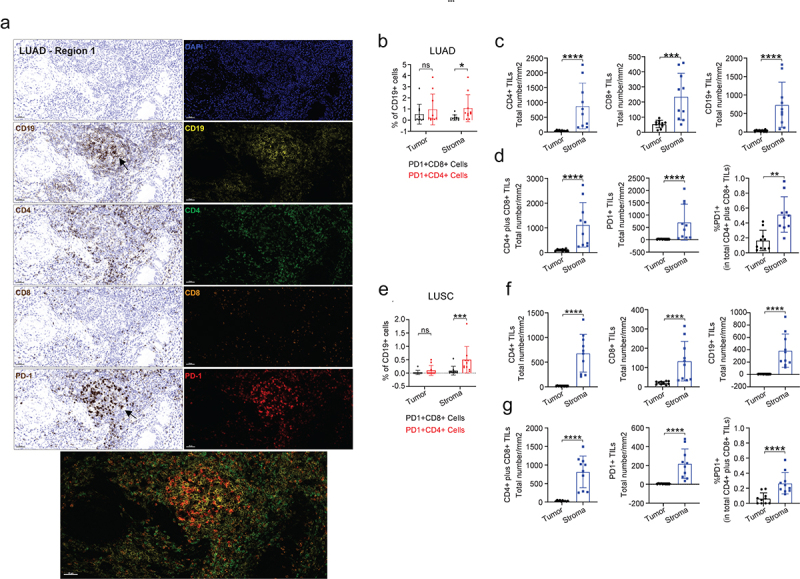
Figure 3.

Multiplexed IHC shows the spatial profiles of immune cell infiltrates in LUAD. (a) Representative regions (200x) showing the spatial expression of the indicated immune markers (CD19, CD4, CD8 and PD-1) in LUAD (pT2bN0M0). (b–d) Individual or selected combinations of the immune markers in A were quantified (10 randomly selected regions, refer to Figure S3A) and shown. **p < .01; ***p < .001 ****p < .0001 by two-sided student’s t-test. ns, not significant. (e–g) Individual or selected combinations of the immune markers in LUSC (pT2bN0M0) sample were quantified (10 randomly selected regions, refer to Figure S3B) and shown. ***p < .001 ****p < .0001 by two-sided student’s t-test. ns, not significant.
