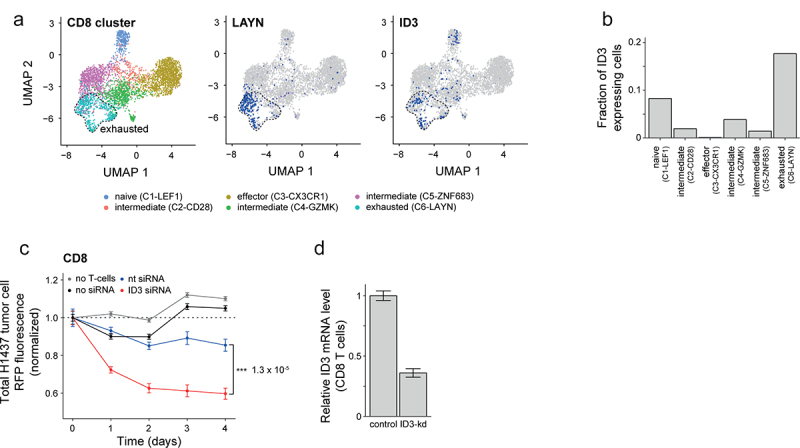
Figure 4.

Downregulation of ID3 enhances effector function of CD8 T cells. (a) Uniform Manifold Approximation and Projection (UMAP) panels showing projection of clusters of CD8 TILs marked by color-code based on single cell data from NSCLC tumor lesions by Guo et al.15 Single cells are shown as dots. (b) Bar graphs showing fraction of ID3 expressing cells enriched within the different single cell CD8 TIL clusters as shown in a. (c) Line graphs showing the kinetics of tumor cell death quantified as a loss of red fluorescence protein (RFP) intensity following coculture with activated CD8+ T cells from blood of healthy donors. Total RFP were normalized to H1437 lung tumor cells cultured with no TILs at time = 0. (d) Bar graphs showing knockdown of ID3 expression in CD8+ T cells derived from PBMCs of healthy donors. Data are displayed as mean ± SD. Data in c, Data in d.
