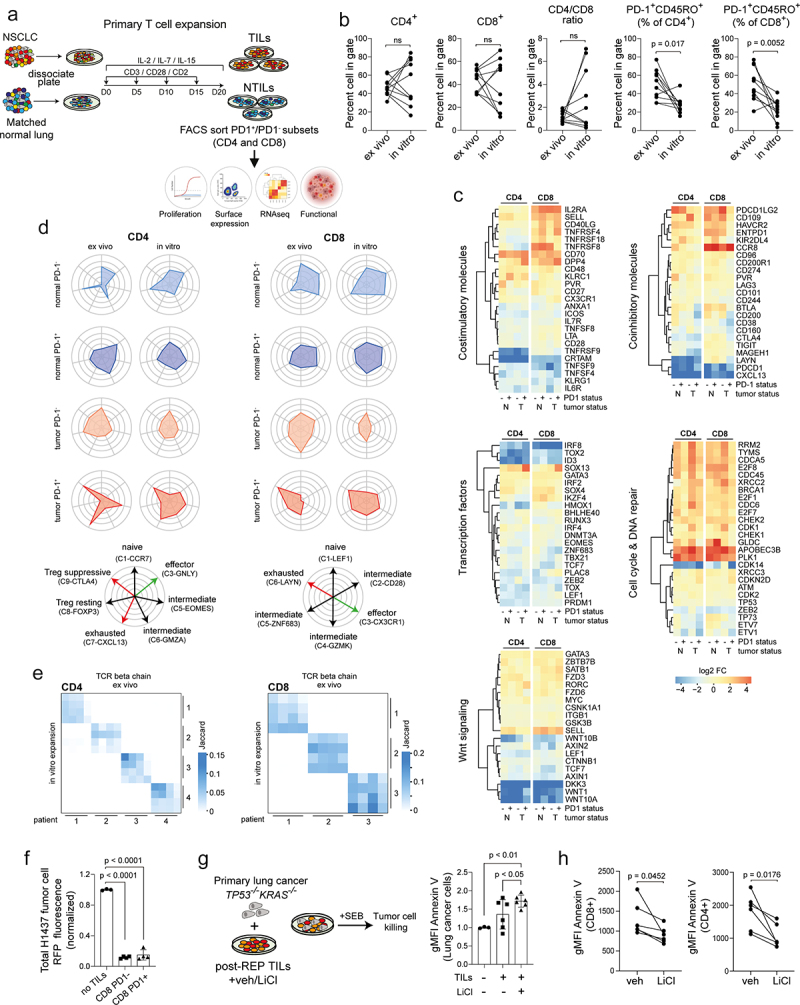
Figure 6.

Transcriptional and functional analysis of memory T cells obtained after in vitro expansion from bulk tumor and matched normal specimens in NSCLC. (a) Graphical overview showing method of the experimental design used to expand T cells from single cell suspension, culture and analysis strategy. (b) Scatter plots showing % change in CD4 and CD8 subsets, CD4/CD8 ratio and memory TILs based on PD1 expression for ex vivo (primary) compared with in vitro (culture expanded) TILs from matched patients (n = 10, biological replicates). (c) Functional heatmaps showing relative gene expression levels of selected candidate genes in memory T cells for the following modules (stimulatory molecules, inhibitory molecules, transcription factors, cell cycle/DNA repair, Wnt signaling) comparing ex vivo and in vitro memory T cell subsets. Each column represents a matched patient. (d) Cell type radar plots correlating expression profile of ex vivo and in vitro memory T cell subsets to single cell TC clusters described by Guo et al.15 (e) TCRβ repertoire analysis showing the degree to which clonal cells in both the CD4 and CD8 memory compartments between groups are maintained. Comparison between ex vivo and in vitro samples based on PD1 status. (f) Histograms comparing tumor killing capacity of in vitro expanded CD8 TILs. Killing capacity measured as loss of RFP intensity. Total RFP normalized to H1437 lung tumor cells cultured with no TILs (n = 4, biological replicates). (g) Schematic representation of experimental setup and histograms comparing tumor killing capacity of in vitro expanded TILs without or with LiCl (2 mM) treatment quantified as the frequency of Annexin V expression in EpCAM+ primary lung cancer cells. Data were normalized to lung tumor cells cultured without TILs. (n = 6, biological replicates). (h) Scatter plots showing change in Annexin V expression in CD8 and CD4 TILs in coculture with primary lung tumor cells without or with LiCl (2 mM) (n = 6 biological replicates). Data in b, g, by paired students t-test, two-tailed. Data in f, g, by one-way ANOVA followed by post-hoc Newman-Keuls. ns, not significant.
