Figure 6.

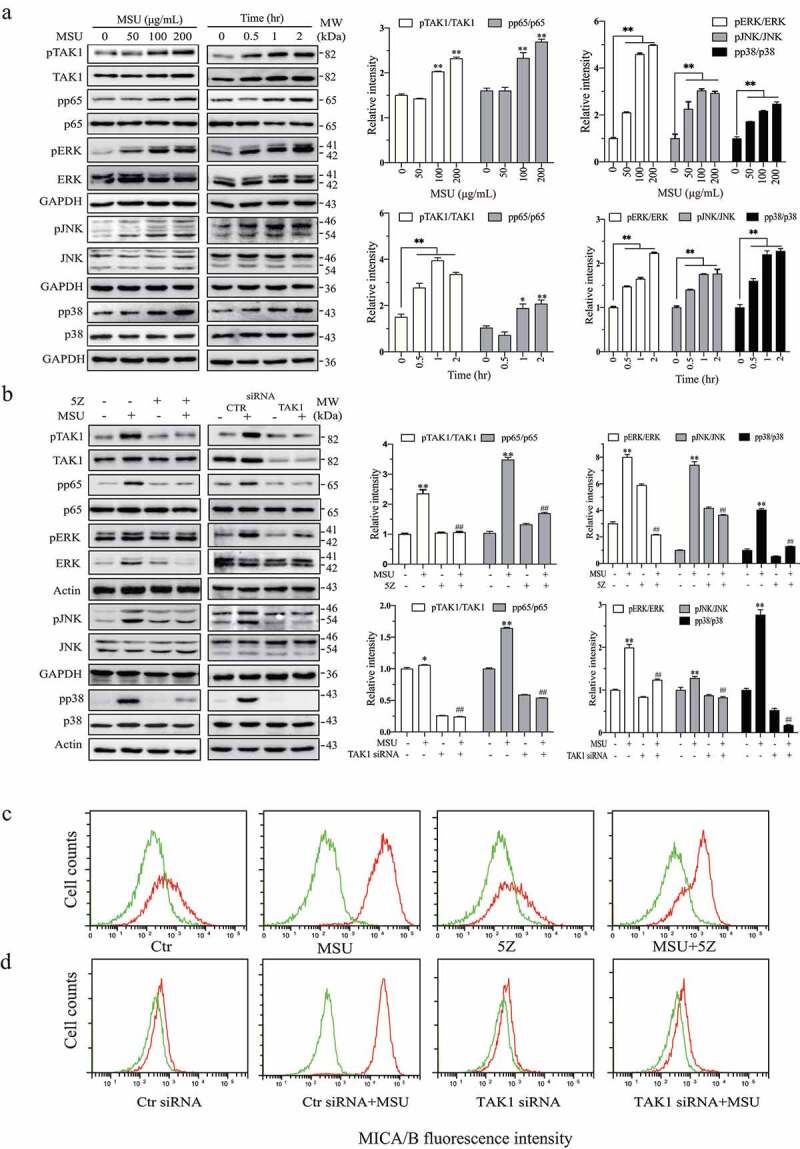
Uric acid activates TAK1 to induce ERK phosphorylation and MICA/B expression. (a) HeLa cells were incubated in the absence or presence of the indicated concentrations of MSU for 2 hr or incubated with MSU (200 μg/mL) for the indicated lengths of time. Cell lysates were prepared and analyzed for TAK1, ERK, JNK, p38, and p65 phosphorylation and their total proteins by Western blot. (b) MSU induces ERK phosphorylation by activating TAK1. HeLa cells were incubated in the absence or presence of MSU (200 μg/mL) and 5Z (5 μM) for 2 hr (b). Alternatively, HeLa cells were transfected with a scrambled control siRNA or TAK1 siRNA. After incubation for 48 hr, the cells were left untreated or treated with MSU (200 μg/ml) for another 2 hr. The cells were harvested and analyzed for TAK1, ERK, JNK, p38, and p65 phosphorylation and their total proteins by Western blot. Relative phosphorylation levels were analyzed by quantifying the density of phosphorylated protein bands normalized by the density of their corresponding total protein bands with NIH Image-J software and presented as bar graphs. Data are the mean ± SD of three experiments. *p < .05, **p < .01, compared to the untreated control. ##p < .01, compared to their corresponding MSU or control siRNA-transfected controls. (c & d) HeLa cells were incubated in the absence or presence of MSU (200 μg/mL) and 5Z (5 μM) for 24 hr. Alternatively, HeLa cells were transfected with a scrambled control siRNA or TAK1 siRNA. After incubation for 24 hr, the cells were left untreated or treated with MSU (200 μg/ml) for another 24 hr. Single-cell suspensions were prepared and stained for MICA/B expression followed by flow cytometry. Green line, isotype control; Red line, MICA/B. The data represent one of three independent experiments with similar results.
