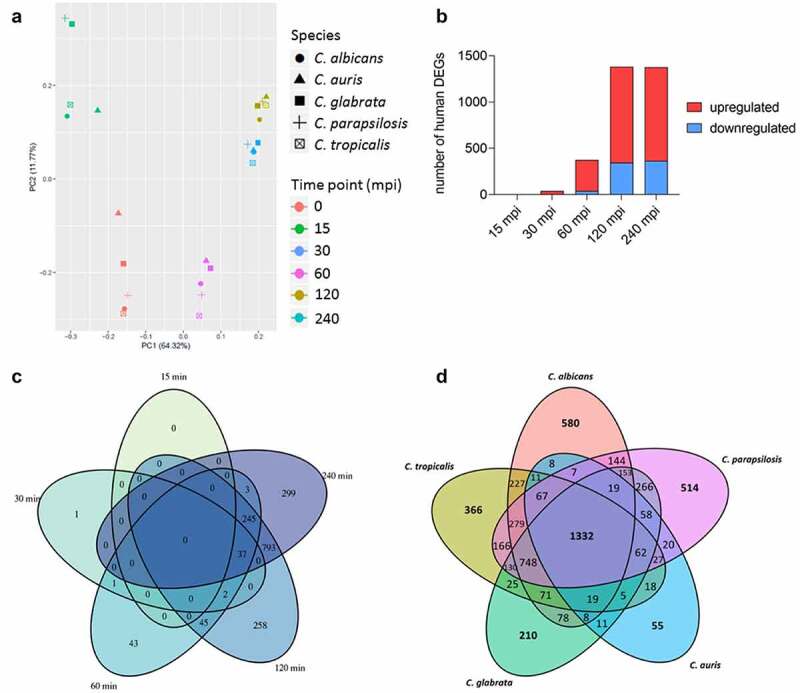
Figure 4.

The human transcriptional response to C. auris in whole blood infection resembles the response to other Candida species. (a) Principal Component analysis (PCA plot) of the human transcriptome based on MRN values. Different time points (color) and Candida species (icon) are indicated to show similarity (b) Transcriptional kinetics shown by the number of human up- and down-regulated genes at different time points during C. auris infection (compared to 0 min) (c) Venn diagram for Homo sapiens comparing differentially expressed genes (DEGs) of each time point (compared to 0 min) during C. auris infection. (d) Venn diagram for infection with each indicated Candida species comparing human DEGs from infection with the indicated Candida species, considering genes differentially expressed during at least one time point.
