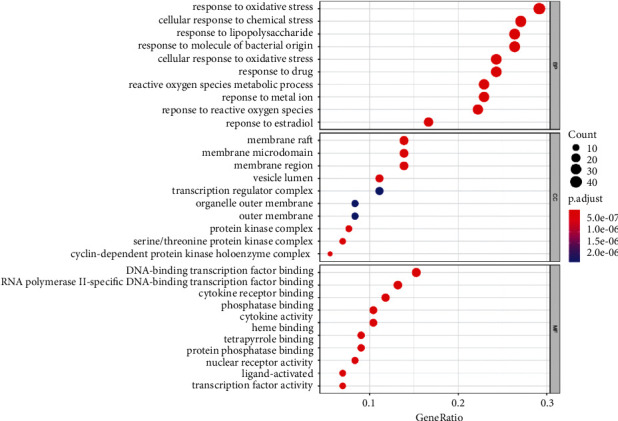
Figure 5.

Top GO enriched terms of HQSJZD in treating CRF. The X-coordinate indicates the number of enriched genes, and the color of the dot represents the P value of the corresponding term. A bigger dot indicates that more genes are enriched.

Top GO enriched terms of HQSJZD in treating CRF. The X-coordinate indicates the number of enriched genes, and the color of the dot represents the P value of the corresponding term. A bigger dot indicates that more genes are enriched.