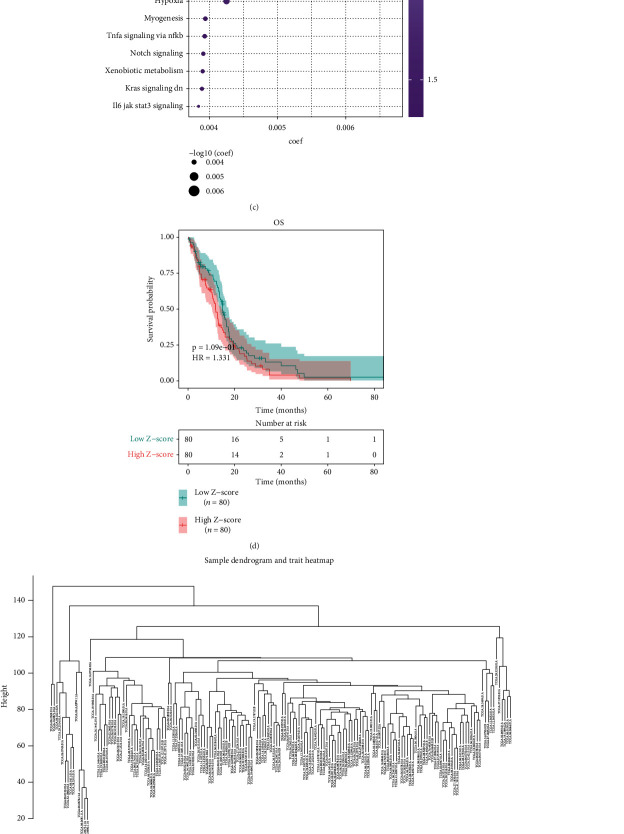
Figure 1.
Hypoxia acts as a dominant risk factor for GBM prognosis in TCGA dataset. (a) Heat map depicted the associations between hallmarks of cancer across GBM samples. Red meant positive correlation while blue meant negative correlation. (b) Heat map visualized the activation of hallmarks of cancer across GBM tissues. (c) Univariate cox regression analysis showed the associations of hallmarks of cancer with GBM prognosis. (d) Kaplan-Meier curves of OS were presented between high and low Z-score of hypoxia groups. (e) Sample dendrogram and trait heat map across GBM samples. (f) Identification of soft threshold (power) value according to scale independence and mean connectivity. (g) Gene dendrogram and identification of coexpression modules identified by unique colors. (h) Heat map showed the associations of coexpression module with hypoxia. (i) Gene significance across different coexpression modules.

